



79% of sales teams miss quota because of poor pipeline management, and teams with strong pipeline visibility are 3× more likely to hit target. One revenue-operations guide also puts the average cost of a single misforecast deal at $14,000 per rep Executive Edge Magazine.
That's why pipeline visibility isn't a reporting nicety. It's the difference between a forecast you can trust and a dashboard that keeps everyone busy while the quarter slips away.
Why Most Pipeline Dashboards Are Lying to You
A lot of teams think they have a visibility problem when they really have a trust problem. The dashboard looks full, the stages look busy, and the forecast call sounds confident, but the numbers still miss because the data behind them doesn't reflect what buyers are doing. The expensive gap is usually a data-quality problem hiding inside a reporting problem.
Healthy pipeline coverage is usually 3 to 4 times quota, which means teams often need $3 to $4 in pipeline for every $1 of revenue goal just to absorb the slippage they know will happen Executive Edge Magazine. That benchmark is useful, but it can also lull leaders into a false sense of control. A team can carry enough volume and still lose if the stages are padded, the close dates drift, or the buyer is no longer engaged.
Practical rule: if your forecast depends on rep optimism more than buyer evidence, your dashboard is giving you comfort, not clarity.
For agency teams, the problem gets wider than sales. Pipeline visibility often breaks in the same place as time capture and utilization reporting, where leaders see activity on a screen but cannot trust the underlying inputs. That is why KPIs for internet marketing dashboards is a useful comparison point, because reporting only works when the measures are tied to real decisions.
The better question is simple. What does the pipeline tell you about risk, momentum, and truth? If the answer is “not much,” then the issue isn't the chart design. It's the quality of the inputs and the discipline around them.
Defining True Pipeline Visibility
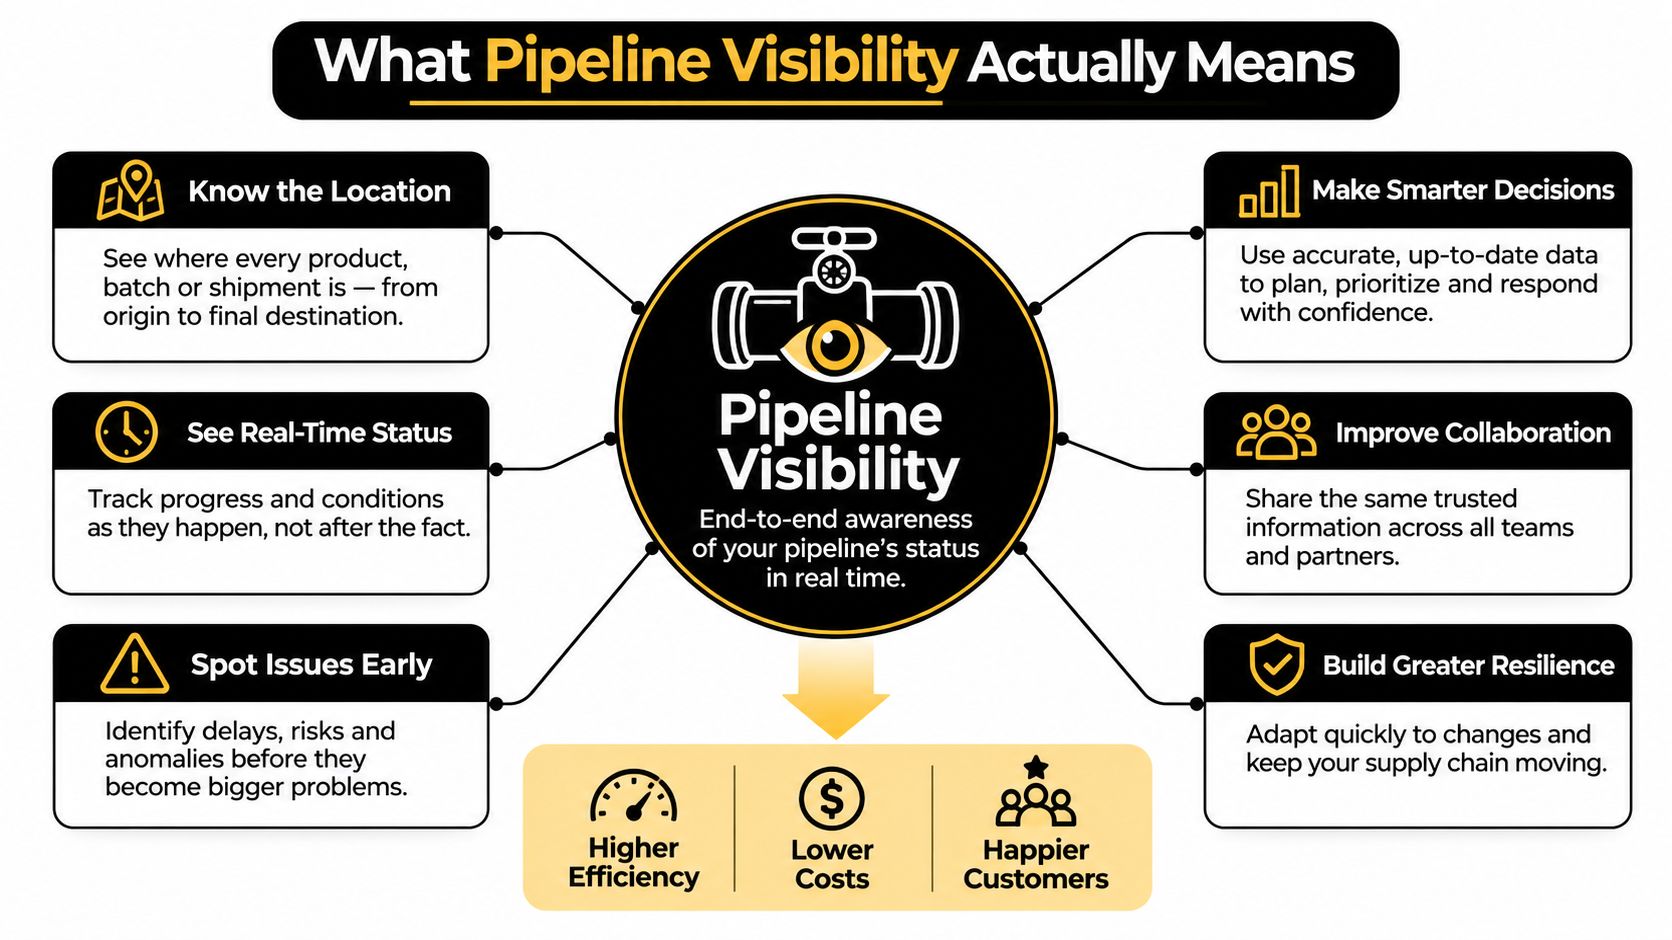
Pipeline visibility means having the real-time ability to see the status, health, and trajectory of every deal, who is involved, what has happened, and where the deal is headed. That is a narrower, more useful definition than “having dashboards.” A dashboard is a surface. Visibility is a decision system.
For agency teams, the definition has to go further. True visibility also shows whether the work behind the pipeline is being captured accurately, because the same trust problem shows up in sales activity, time capture, and utilization reporting. Leaders can stare at a clean report and still be operating on stale inputs, late CRM updates, or timesheets that describe effort more neatly than reality. The definition only holds when the numbers reflect buyer motion and the actual use of team capacity.
Visibility depends on data you can trust
Visibility breaks when teams treat manual CRM updates as truth. If reps enter activity late, classify stages loosely, or rely on separate tools that do not sync, the CRM starts telling a story that looks complete but is not. A similar gap shows up in agency reporting, where leaders may have the right charts but not enough confidence in the underlying input. For a practical comparison point, KPIs for internet marketing dashboards shows how reporting only becomes useful when the measures are tied to real decisions.
A stronger definition starts with clean stage rules, automated activity capture, and checks against real buyer behavior. More data does not solve the problem by itself. Better data does. The system has to separate seller activity from buyer motion and apply the same stage criteria every time, or the pipeline will look more stable than it is.
The buyer has to matter more than the rep
A rep can keep a deal “on track” in the CRM long after the buyer has gone quiet. Real visibility has to include observable buyer behavior, not just seller updates. If the buyer has not met, replied, reviewed, or brought in stakeholders, the stage label does not mean much.
That same standard applies to agency work tracking. A project can look healthy in a timesheet report while the actual pattern of hours and capacity tells a different story. Marketing agency reporting only becomes useful when it shows what teams did, not what they hoped the record would say. Good visibility is about whether the system reflects reality, not whether it looks tidy.
Key Pipeline Visibility Metrics
The numbers that matter are the ones that show whether the pipeline is healthy, moving, and believable.
Start with coverage, then test quality
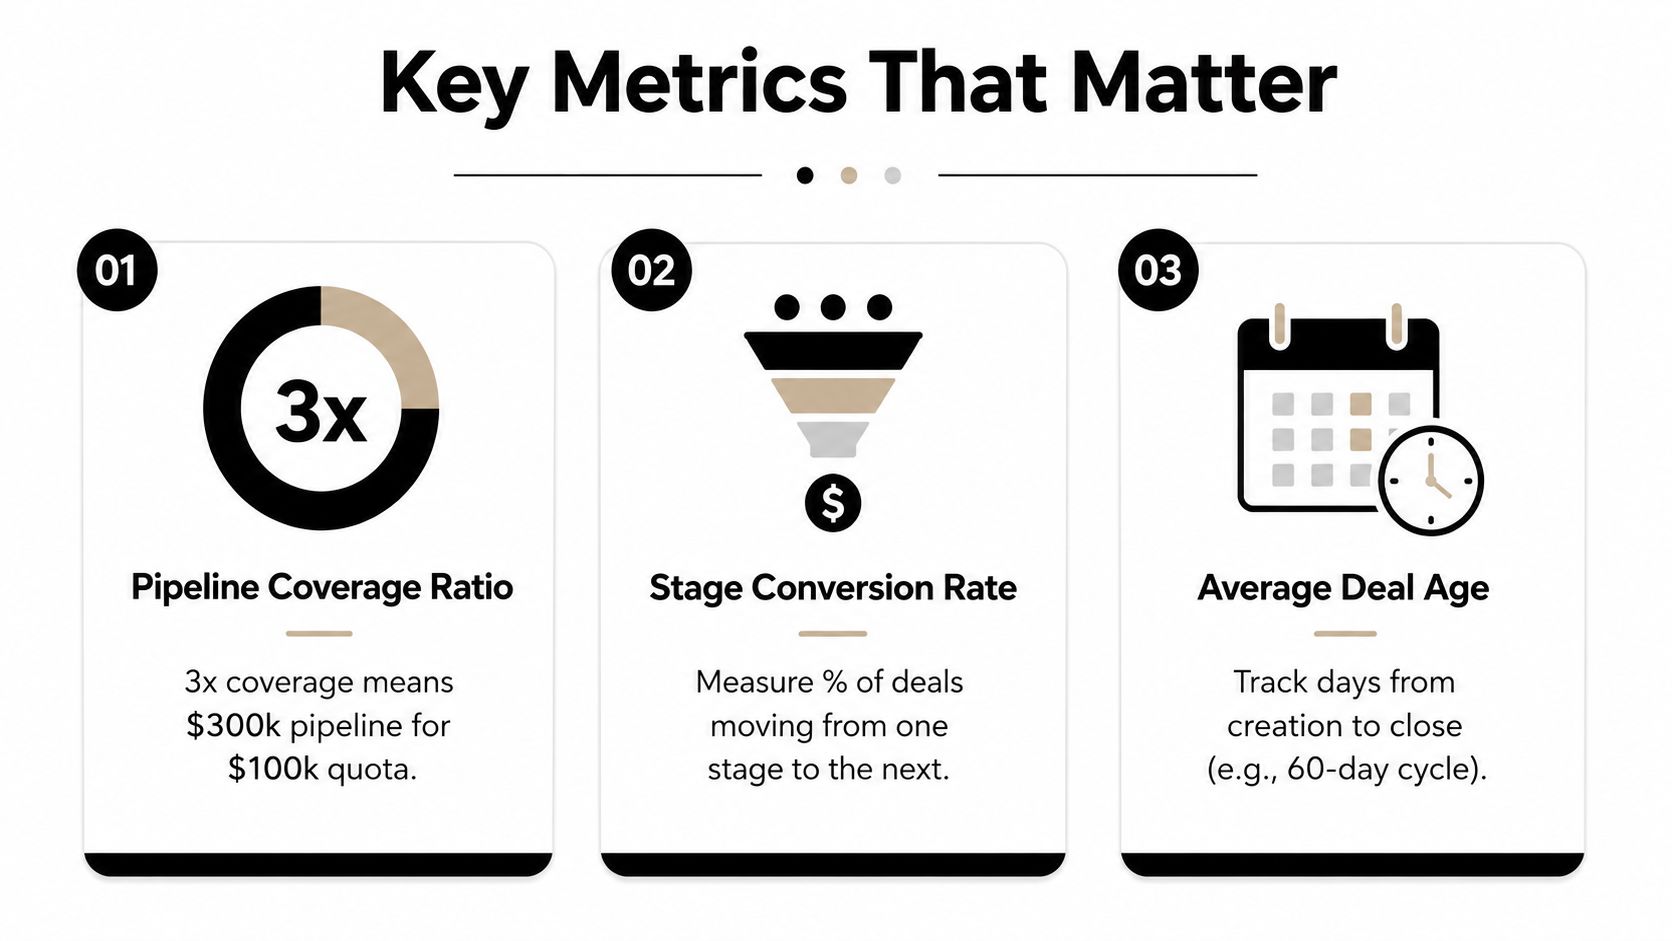
Pipeline coverage ratio is the first check. Healthy teams usually need a cushion above quota so they can absorb slippage and lost deals, but coverage by itself can still hide a weak pipeline if it is padded with opportunities that will never close.
Pipeline velocity shows how quickly deals move through stages, which helps surface drag before it turns into missed revenue. Stage conversion rate shows where deals stop advancing, so you can see whether the problem sits in qualification, proposal, legal, or procurement. Deal aging shows how long an opportunity sits in each stage, which is usually where stalled deals start to show their real shape.
A deal that sits too long in a stage is not just slow, it is asking for review.
Use alerts, not guesswork
Aging becomes useful when it triggers action. One operational guide recommends flagging deals that spend 1.5 times their average stage duration as a warning and 2 times as a red alert.
That threshold matters because it turns a stagnant report into a decision. If a deal is still sitting in proposal or legal past that line, someone needs to ask a hard question about what is blocking it.
Engagement signals round out the picture. Meeting frequency, multi-threaded contact, and competitive presence show whether the buyer is active or whether the deal is surviving on internal hope. That is the difference between a pipeline that looks full and one that can close.
For agency leaders, the same logic shows up in marketing agency reporting. If a metric does not change a decision, it is just decoration.
Common Pipeline Visibility Obstacles and How to Spot Them
The biggest visibility problems usually hide in plain sight. Teams often think they need more reporting when what they really need is less noise and better discipline.
Manual updates create delay
Manual CRM entry is the oldest problem in the book. Reps get busy, notes go in late, and close dates drift until the pipeline starts reflecting memory instead of reality. By the time the data is updated, the quarter has already moved on.
Fragmented tools hide the full story
Conversation intelligence, buyer signals, and CRM records often live in separate places, which means nobody sees the whole deal in one view. That creates a false sense of completeness because each system tells part of the story, but none of them tells the whole one. If the rep's activity, the buyer's engagement, and the forecast category aren't connected, visibility is thin no matter how polished the dashboard looks.
Loose stage definitions inflate the pipe
When stage definitions are vague, reps classify deals in the most generous way possible. That inflates pipeline value without adding signal, and it makes the team feel healthier than it is. Weak stage discipline is one of the fastest ways to turn pipeline visibility into pipeline fiction.
Coverage ratios can hide bad quality
A team can have enough coverage and still miss target if the conversion rates are poor or the deals are aging badly. That's why coverage should never be the only thing leaders inspect. Quantity without quality just makes the forecast bigger, not better.
A Tactical Roadmap to Improve Pipeline Visibility
A dashboard does not fix pipeline visibility. A trustworthy process does.
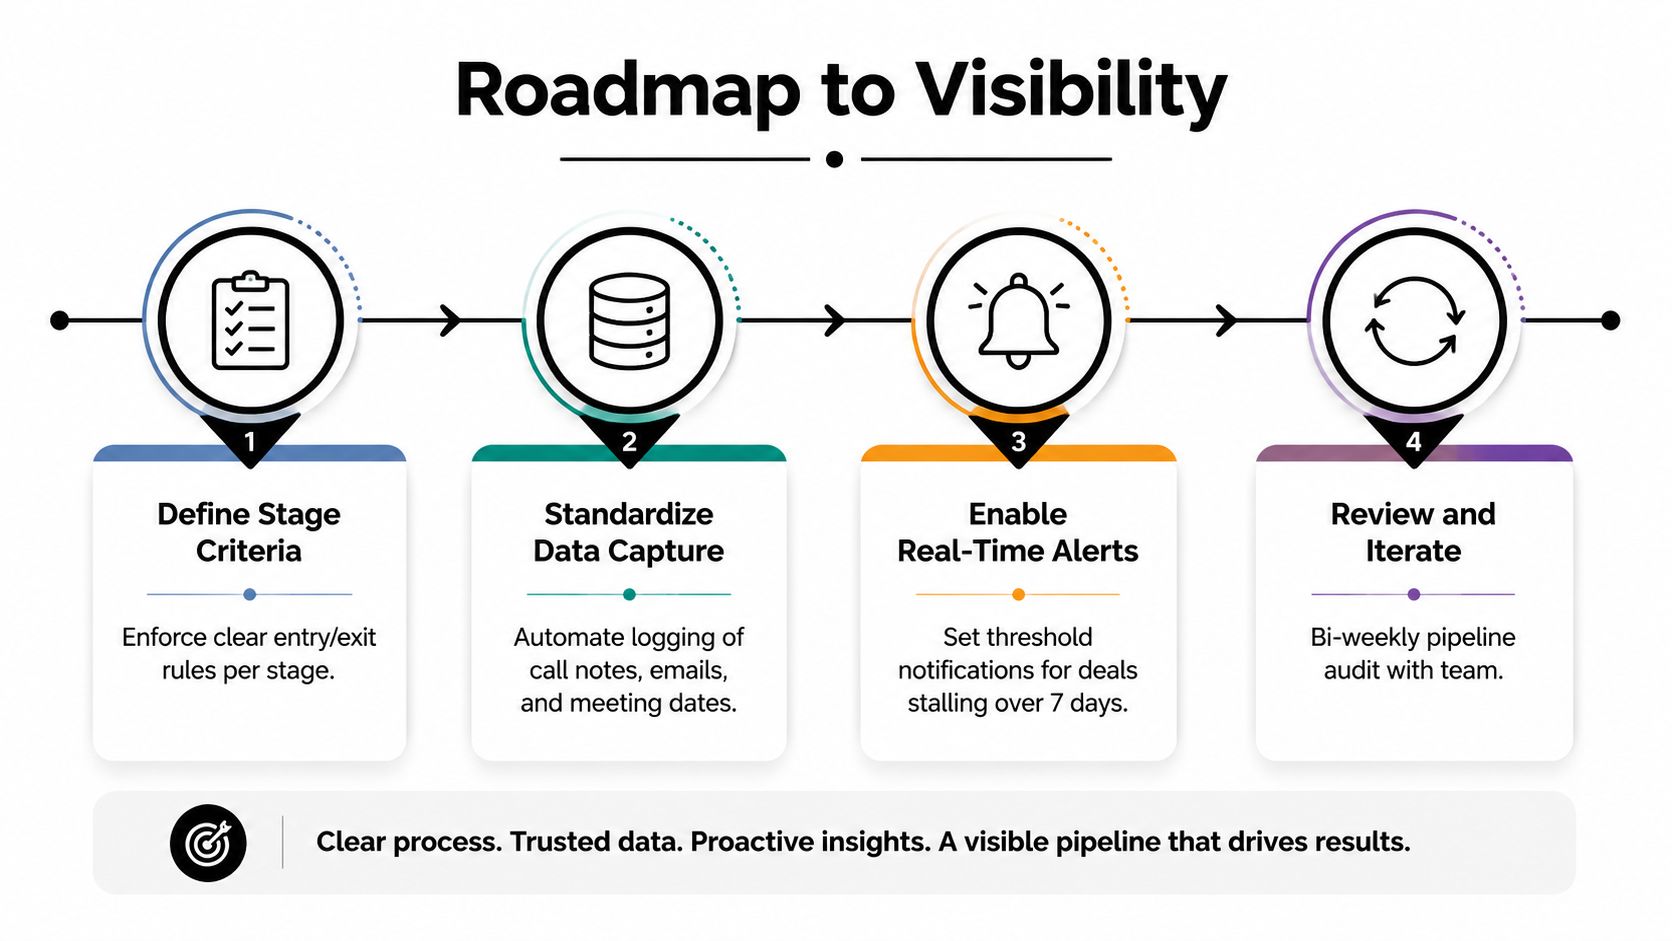
Define stage rules around buyer commitments
Start with stage definitions a manager can enforce. Stages should be tied to observable buyer commitments, not vague optimism or a rep's best guess. Qwilr recommends flagging deals that sit too long without review Qwilr. That approach matters because it forces progression to rest on evidence, not on what someone hopes the deal will become.
Clean the data sources before you add more tools
A usable view starts with a CRM as the system of record, conversation intelligence for engagement signals, and a data enrichment layer for buyer context. Those inputs need to feed one synthesis layer so leaders can see the deal in one place instead of chasing it across tabs. If the system cannot separate real movement from logged activity, the forecast will keep drifting, and the dashboard will keep looking more certain than it is.
For agencies, calendar-based time capture fills a gap that sales teams often miss. It connects actual effort to pipeline activity in a way the CRM usually cannot, which helps show whether the team's time is lining up with the deals in motion. That is a better read than activity counts alone because it ties work to the deal, not just to the log. If you are also thinking about agency-level lead generation, the same logic applies. More leads do not help if the system cannot tell you which ones are real, engaged, and worth the next hour of effort.
Standardize tags and automate capture
Once the stage rules are set, clean the properties that feed reporting. Use the same tags for client type, deal type, region, and workflow so the numbers mean the same thing across teams. Then automate activity capture wherever you can. Every manual field you remove lowers the chance of stale or sloppy data, and every clean field makes the forecast easier to trust.
Put governance around aging and exceptions
Weekly pipeline reviews work best when they focus on aging alerts, stalled deals, and stage-time limits. The point is not to put pressure on reps for its own sake. It is to force early review before a deal becomes an end-of-quarter surprise.
The article on API data integration is useful if your team wants to move data cleanly instead of patching it by hand.
Choosing the Right Tools and Integrations for Your Pipeline
Tool choice should come after process choice, not before it. If you don't know how your stages work, what data matters, and which signals define a healthy deal, the tool just gives you another place to hide bad inputs.
Compare tools by the job they have to do
A basic CRM is the foundation, but it won't carry visibility on its own. You also need conversation intelligence to capture engagement, a synthesis layer to unify the signals, and dashboards that surface the metrics that matter. The best tool stack cuts manual work and improves confidence in the data. The wrong one adds another screen and another login.
For agencies, the missing link is often the calendar. Calendar-based time capture connects actual effort to pipeline activity in a way a CRM can't, which matters when you're trying to understand whether the team's work pattern matches the deals in motion. That's a better lens than chasing activity counts alone because it ties the work to the deal, not just the log.
If you're also thinking about agency-level lead generation, the same rule applies. More leads don't help if the system can't tell you which ones are real, engaged, and worth the next hour of effort.
Look for integrations that reduce friction
The best setup gives you rule-based tagging, flexible filtering, and exports for deeper analysis. It also plays well with the systems your team already uses, because visibility falls apart when people have to update one more field in one more place. If your stack still needs manual cleanup every week, it's not a visibility system. It's a reporting burden.
Putting Pipeline Visibility Into Practice
An agency can show a healthy pipeline on paper and still miss quarter after quarter if the team cannot see real buyer momentum. The fix starts with calendar-based time tracking that ties every client call, proposal session, and project review to the right deal, so leaders see actual effort instead of rough memory. Once that work is captured correctly, custom tags can sort it by project type, client tier, and revenue impact, which gives managers a clearer view of where time is going and why certain deals move while others stall.
Rule-based alerts handle the gaps people miss. When a deal sits in proposal longer than the stage benchmark, the system can flag it before the weekly meeting, along with the last activity date, buyer engagement signals, and any competitive presence. That keeps managers from guessing and forces a review of the deals that have gone stale. It also cuts down on the polite team-room debate about whether the update is real or just cleanup in the CRM.
I've seen this change forecasts because the team stops arguing about who updated what and starts looking at the same evidence. The rep still owns the deal, but the manager finally has a dependable view of the motion behind it. That's the point where visibility stops being a dashboard and starts acting like a control system, which matters if you want to learn how to improve forecast accuracy.
If you want to tighten that loop, TimeTackle helps teams connect calendar activity, tags, and reporting so work shows up the way it happened. Calendar-based capture also gives agency leaders a cleaner read on utilization, which is the part most pipeline reports ignore until the quarter is already slipping.