Improving your forecast accuracy isn't about chasing perfect numbers. It’s about building a reliable system. This means defining clear metrics, cleaning up your data sources, and fostering a culture of continuous learning. When you lay this foundation, forecasting stops being a guessing game and becomes a strategic tool for making smarter decisions.
Why Most Business Forecasts Fail
Let's be honest: many business forecasts are wildly off the mark. It’s a common frustration, but the fix isn't some magical algorithm or an expensive new tool. The real problem is almost always a shaky foundation built on messy data, disconnected processes, and vague goals.
When teams operate without a shared definition of success, the forecast becomes a source of confusion, not clarity. The first step is to stop aiming for perfection and start building a dependable system from the ground up. This requires a fundamental shift in mindset. Instead of treating forecasting as a purely mathematical exercise, you need to see it as a reflection of your operational health.
The Real Root Causes of Inaccuracy
Inaccurate forecasts are just symptoms of deeper issues. They often signal a disconnect between departments or a total lack of standardized procedures. For example, if your sales team’s CRM data doesn't align with how your finance team recognizes revenue, your forecast is doomed from the start.
Common culprits behind failed forecasts usually include:
- Siloed and Unreliable Data: Information is scattered everywhere—CRM, financial software, time tracking tools—with no single source of truth.
- Undefined Processes: Without clear, objective criteria for each stage of a sales pipeline or project, a forecast is built on subjective hunches, not hard evidence.
- Lack of Accountability: When no one truly owns the forecast's accuracy, there’s very little incentive to question assumptions or learn from past mistakes.
The goal isn't just to predict the future; it's to create a system so reliable that it helps shape a more predictable future. This turns forecasting into an active management tool, not just a passive report.
Learning from Other Fields
This isn't a problem unique to business. Just look at the incredible progress made in weather prediction. Over the last 50 years, weather forecasting has become dramatically more accurate thanks to better satellite data, advanced computational models, and the integration of real-time measurements.
A 4-day forecast today is as accurate as a 1-day forecast was just 30 years ago. It’s a powerful reminder that with better inputs and constant refinement, even highly complex systems can become remarkably predictable. You can read more about these forecasting improvements on Our World in Data.
Building a Reliable Data Pipeline
Let’s be honest: an accurate forecast is impossible without clean, reliable data. Before you even think about fancy algorithms, your first job is to build a data pipeline you can actually trust. Without this foundation, any effort to improve forecast accuracy is just guesswork built on a shaky base.
Think of your data as the raw material for your forecast. If the material is flawed—incomplete, inconsistent, or just plain wrong—the final product will be useless. This isn't just a technical problem; it's a core business issue that quietly sabotages projections and erodes leadership's confidence.
The journey toward a reliable forecast starts with a thorough audit of your key data sources. This means rolling up your sleeves and getting into the weeds of your CRM, financial systems, and even your team's calendars.
Auditing Your Critical Data Sources
Your CRM is usually the main source of forecasting data, but it can also be the biggest source of error. Stale deals, duplicate entries, and wishy-washy stage definitions create a distorted view of your pipeline. A deal that has been sitting in "Negotiation" for six months isn't a real opportunity; it's pipeline pollution.
At the same time, your financial systems hold the ultimate record of truth for revenue. But if sales and finance use different rules for revenue recognition, their numbers will never line up. This creates two competing versions of reality, making a single, cohesive forecast impossible.
To fix this, you have to get disciplined:
- Standardize CRM Stages: Establish objective, non-negotiable entry and exit criteria for each stage of your sales process. This ensures every team member categorizes opportunities the same way, every time.
- Implement Data Hygiene Rules: Create automated workflows to flag stale deals, identify duplicate contacts, and enforce mandatory fields for new entries. Don’t let the junk pile up.
- Align Sales and Finance Data: Get both teams in a room (virtual or otherwise) and hammer out a single, unified definition for key metrics like "booked revenue" and "recognized revenue." This creates a shared language and a single source of truth.
You can see how this process of defining, aligning, and cleansing your data fits into the bigger picture below.
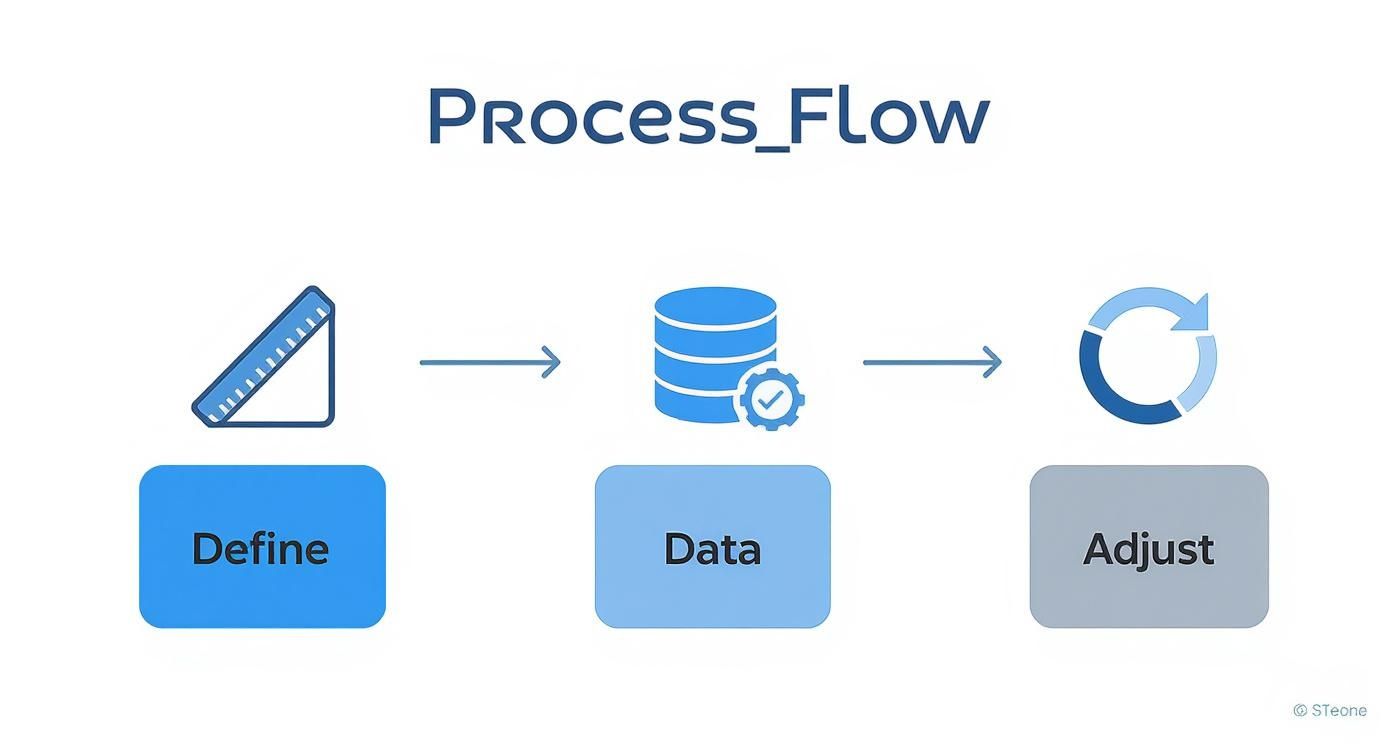
This flow shows that a solid data foundation isn't just a nice-to-have; it's the essential second step that bridges the gap between defining your goals and actually calibrating your forecasting models.
Automating Data Capture to Eliminate Errors
Even with clean systems, manual data entry is a huge threat to accuracy. Every time a team member has to log an activity, update a deal, or track their time, there's a risk of human error. They might forget, get a detail wrong, or just be inconsistent. These small errors add up, slowly poisoning your entire dataset.
Automation is the only real way to combat this.
By automatically capturing critical activities directly from the source—like emails, calendar events, and meetings—you eliminate the reliance on manual input. This ensures your data is not only complete but also captured in real-time.
A common scenario we see is a company where sales reps spend hours each week manually logging calls and meetings in the CRM. Not only is it a grind, but the data is often patchy. After automating activity capture, they saw a 30% reduction in admin work and a dramatic improvement in data richness, which fed directly into a more accurate forecast.
Looking at how other industries use data, like leveraging property data insights to make informed decisions, reinforces this core principle: high-quality, automated data capture leads to better outcomes.
Putting your data at the center of your operations is no longer optional. It's a requirement for success. You can learn more about why, in 2023, data needs to be at the center of your organization to build a more resilient business strategy.
This approach creates a virtuous cycle. Better data leads to more accurate forecasts, which in turn builds trust and encourages everyone to maintain data quality. Your data pipeline transforms from a leaky, unreliable system into a genuine strategic asset.
Choosing the Right Forecasting Method
Once you’ve got clean, reliable data, the next big hurdle is picking the right forecasting method. Let's be clear: there’s no magic bullet. The "best" model doesn't exist. The most effective approach is always the one that fits your specific situation—your industry, how mature your data is, and how volatile your market is.
This isn’t about chasing the most complex algorithm you can find. It's about finding the most appropriate one. A simple moving average might be all a stable business with years of historical data needs. On the other hand, a startup in a rapidly changing market is going to need something far more dynamic. The goal is simply to match the tool to the task.
Comparing Common Forecasting Approaches
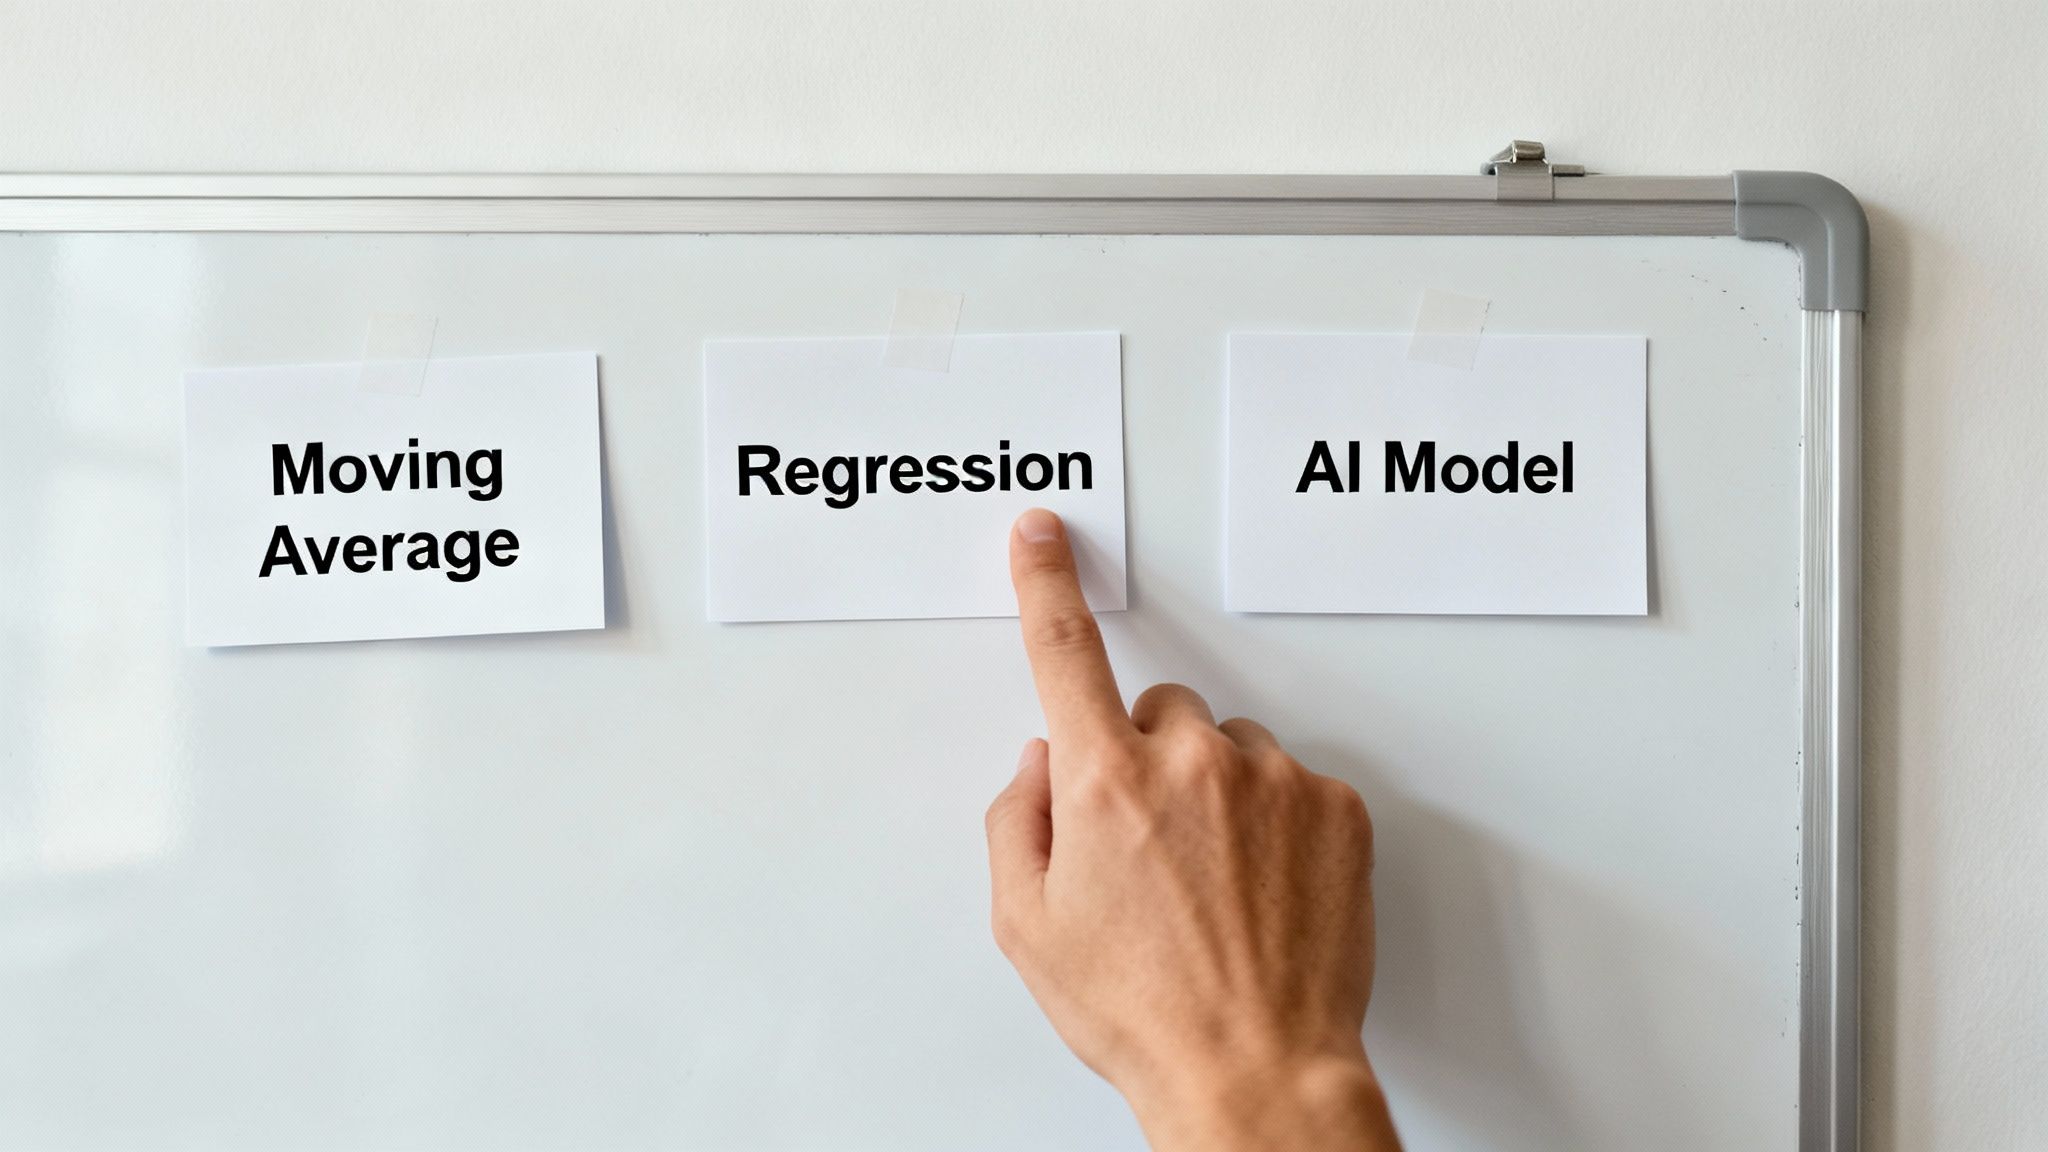
Let’s break down a few of the most common methods, focusing on when you'd actually use them in the real world.
-
Historical Methods (e.g., Moving Averages): This is forecasting at its most basic. It works on the assumption that the future will look a lot like the recent past. A three-month moving average, for example, just averages your last three months of sales to predict the next. It’s dead simple to set up but will completely miss the mark if your business has strong seasonality or is growing fast.
-
Regression Analysis: This is a step up, allowing you to identify the relationships between different variables. You could use regression to see how your marketing spend or the number of sales demos in a month actually impacts future revenue. It’s a lot more powerful than just looking at historical averages because it starts to explain the why behind your numbers.
-
Machine Learning and AI Models: Here we have the most advanced options. AI models can chew through massive, complex datasets to find subtle patterns that a human analyst would never spot. For instance, an AI might find a correlation between local weather patterns and sales of a particular product line. These models are incredibly powerful, but they demand huge amounts of clean data and specialized skills to build and manage.
As you figure out how to improve forecast accuracy, you need to be honest about these options. Don't leap to an AI solution if a straightforward regression model built on solid data will get the job done more effectively and transparently.
A Practical Checklist For Selecting Your Model
To help guide your decision, run through these three critical questions. Your answers will almost always point you toward the right forecasting method for your company.
-
What is our data maturity? Do we have years of clean, structured historical data ready to go, or are we just starting to piece our data pipeline together? Historical methods need good data history, while AI models need massive, detailed datasets to learn from.
-
How volatile is our business environment? Is our demand steady and predictable, or does it swing wildly based on seasonality, market trends, or what competitors are doing? The more volatile things are, the more you need a model that can account for external factors, like regression or AI.
-
What resources can we commit? Do you have a data scientist on the team, or are you relying on an ops manager who's a whiz with spreadsheets? Be realistic about the time and technical expertise required to not only implement a model but also maintain it.
A classic mistake is over-investing in a complex model before nailing the fundamentals. A well-maintained regression analysis built on clean data will consistently outperform a fancy AI model running on garbage inputs.
It's always valuable to compare different approaches. Think about how development teams estimate project timelines; they often look at different frameworks. Reading up on how teams evaluate Planning Poker vs. other estimation techniques can offer a great mental model for weighing the pros and cons of various forecasting methods.
The Power Of Advanced Analytics
For organizations that are ready to level up, the impact of more advanced methods can be huge. Implementing advanced analytics and machine learning has been shown to improve forecast accuracy by 15-30% compared to traditional methods. Businesses with highly variable demand—or those that have been relying on simple historical averages—often see gains closer to that 30% mark. These models are just better at connecting the dots between variables like social media sentiment or even in-store foot traffic.
Back-Testing and Calibration
No matter which method you land on, you absolutely have to validate it. Back-testing is the process of using your model to "predict" past results with historical data. For example, you could feed it your data from two years ago and see how well it would have forecasted the following year.
This step is non-negotiable. It helps you see your model's biases—does it consistently overshoot or undershoot?—and lets you fine-tune its settings for better performance down the road. Once your forecast is live, visualizing the results is the best way to spot trends and share what you're learning. For a deeper dive, check out our guide on data visualization best practices.
Creating Governance and Feedback Loops
A great forecast isn't a static report you create once a quarter and then forget about. It's a living, breathing process that should be woven directly into your company’s operational rhythm. To really dial in your forecast accuracy, you have to move beyond just the numbers and build a system of strong governance and systematic feedback loops.
This approach transforms forecasting from a passive prediction into an active tool for strategic agility. It creates a culture of accountability where everyone, from individual reps to the executive team, understands their role in the process. More importantly, it shifts the focus from blame to learning.
Establishing a Tiered Review Process
The most effective way to build accountability is with a tiered review system. This ensures the forecast gets scrutinized and refined at every level of the organization, creating a clear chain of ownership. Each layer adds a different perspective, strengthening the final projection.
This process usually looks something like this:
- Individual Contributor Review: Sales reps or project leads review their own pipelines and projections with their direct managers. The focus here is on the ground-level reality of specific deals or projects.
- Team or Departmental Review: Managers consolidate their team's forecasts and present them to department heads. This is where cross-team dependencies and resource constraints start to become visible.
- Executive Review: Department heads present the rolled-up forecast to the executive team. This final review connects the forecast to high-level business objectives, like hiring plans, marketing spend, and cash flow management.
This structured cadence ensures that by the time the forecast reaches leadership, it has been thoroughly vetted and challenged. It’s no longer just a collection of numbers; it's a well-reasoned plan.
Fostering a Blameless Culture
One of the biggest roadblocks to an accurate forecast is fear. When people are afraid of being penalized for missing a number, they become overly optimistic or sandbag their projections. Neither helps the business make smart decisions.
The key is to build a blameless culture where forecast misses are treated as valuable learning opportunities, not as failures. When you miss a forecast, the conversation shouldn't be about who was wrong. Instead, it should be about why the forecast was wrong.
A forecast variance isn’t a mistake to be punished; it's a signal that one of your underlying assumptions was incorrect. Your job is to find that assumption and fix it for next time.
This approach encourages honesty and transparency. When team members know they can openly discuss why a deal slipped or a project was delayed without fear of retribution, you start to get real, actionable insights that make future forecasts much more accurate.
Running an Effective Variance Analysis Meeting
To put this blameless culture into practice, you need a dedicated forum for reviewing past performance. A "Forecast Variance Analysis" meeting, held monthly or quarterly, is the perfect tool for this. The sole purpose of this meeting is to compare the previous period's forecast to the actual results and dig into the differences.
Here’s a simple template for the key questions to guide this discussion:
- What was the gap? Quantify the difference between the forecast and the actual result in clear terms.
- Why did we miss? Identify the specific deals, projects, or market factors that caused the variance.
- What assumptions were wrong? This is the most critical question. Did we assume a deal would close faster than it did? Did we underestimate the resources a project would require?
- What do we need to change? Define the specific actions you will take to improve the process, data, or assumptions for the next forecasting cycle.
This structured process prevents the meeting from devolving into finger-pointing and keeps everyone focused on continuous improvement.
For instance, one enterprise software company saw its forecast accuracy jump from 67% to 94% in just six months. This wasn't magic; it was the result of a multi-pronged strategy that included a tiered review process and rigorous data hygiene. Their success underscores how structured governance is essential for achieving superior forecast accuracy. You can discover more insights about their forecasting improvements on Forecast IO. This proves that with the right feedback loops, dramatic improvement is well within reach.
Automating Your Forecasting Process
Let’s be honest: trying to manage forecasting with manual processes is a recipe for burnout. It’s tedious, prone to errors, and simply doesn't scale. As your business grows, the sheer volume of data and complexity of your models will quickly overwhelm any spreadsheet-based system. This is where you flip the script. Automation can transform your forecasting from a soul-crushing administrative chore into a powerful strategic engine.
When you build an automated system, you’re creating an efficient, repeatable, and trustworthy process. It's about much more than just saving time; you're fundamentally improving the quality and timeliness of the data that fuels your predictions. Once you set up these workflows, they run consistently in the background, freeing up your team to focus on what actually matters—analyzing the results and making smarter decisions.

Streamlining Data Collection and Model Execution
The first—and arguably most impactful—area to automate is data collection. Manually pulling numbers from your CRM, financial software, and project management tools is a slow drag. Worse, it’s a minefield for human error. A single copy-paste mistake can send an entire forecast off the rails.
Instead, automation tools can connect directly to these systems via APIs, creating a clean and seamless data pipeline. This ensures the information flowing into your forecasting models is always current and accurate.
Once the data is flowing, the next step is to automate the models themselves. Whether you’re using a simple moving average or a more complex regression analysis, you can schedule these models to run automatically—daily, weekly, or monthly. This establishes a consistent, reliable rhythm for your forecasting process.
Here are a few key areas to target first:
- CRM Data Sync: Automatically pull the latest pipeline data, like deal stages, values, and close dates. No more nagging reps for updates.
- Financial Data Integration: Sync actual revenue and expense data to instantly compare against your forecast.
- Model Execution: Set your chosen forecasting models to run on the latest data without anyone needing to lift a finger.
Capturing the Elusive Activity Data
One of the biggest blind spots in any forecast is the lack of accurate activity data. How many meetings did it really take to close that last big deal? How much time did the pre-sales team spend on a specific opportunity? This information is a goldmine for improving accuracy because it reveals the true effort behind the numbers.
The problem? It’s also the hardest data to get. Nobody wants to spend their day manually logging every single call and meeting. This is where a tool like TimeTackle becomes a game-changer.
By connecting directly to your team’s calendars, TimeTackle automatically captures all sales and project-related activities—meetings, calls, you name it—without any manual entry. This creates a rich, objective dataset that links effort directly to outcomes. You can finally see precisely how your team is investing its time and build that insight into much more accurate, resource-aware forecasts.
I once worked with a tech company that spent a full week every single month manually compiling forecast data. After they automated their data capture and reporting, that cycle shrank to just a few hours. This didn't just save time; it allowed their analytics team to shift from tedious data entry to high-value strategic analysis, leading to forecasts that the entire company could trust.
Automating Your Reporting and Dashboards
The final piece of the puzzle is the output: your reports and dashboards. A forecast is useless if it’s just sitting in a file on someone's desktop. It needs to be visible, accessible, and easy for everyone to understand.
Stop building charts and slides by hand for every forecast review. Instead, set up automated dashboards that update in real-time. These dashboards can visualize key metrics, track forecast variance, and highlight important trends, making your review meetings infinitely more productive.
This end-to-end automation—from data collection to report generation—creates a reliable and scalable forecasting machine. If you need some inspiration, exploring different business process automation examples can give you a practical roadmap. This shift doesn't just improve your forecast accuracy; it helps build a smarter, more data-driven culture.
Answering Your Top Forecasting Questions
Even with a rock-solid process and squeaky-clean data, questions inevitably pop up. That’s a good thing. Getting comfortable with the gray areas and nuances of forecasting is a huge part of the journey. Let’s tackle some of the most common questions we hear from teams who are getting serious about their projections.
These aren't just abstract ideas; they're the real-world hurdles that can stall progress. By hitting them head-on, you can keep your team confident and the momentum going.
What Is a Good Forecast Accuracy Percentage?
This is, without a doubt, the question we hear most often. And the answer is always the same: it depends.
There's no magic number that works for everyone. A consumer goods company with predictable demand might be shooting for 95% accuracy or even higher. On the flip side, a fast-scaling tech startup in a chaotic market would likely pop the champagne for hitting 80%.
Your industry, business model, and the stability of your market change everything. Instead of chasing an arbitrary target, you’re much better off focusing on two things:
- Beating Your Own Benchmark: Your main goal should always be to improve on your past performance. If you hit 85% accuracy last quarter, the target for this quarter is 87%. Simple as that.
- Rooting Out Bias: Are your forecasts consistently too high or too low? A low bias—meaning you aren't always erring in the same direction—is often more valuable than a high accuracy score. It shows your underlying assumptions are balanced, even if they aren’t perfect.
The true mark of a great forecast isn't a single percentage. It's the upward trend of your accuracy over time and your ability to consistently shrink the gap between your projection and what actually happens.
How Often Should We Update Our Forecast?
The right forecasting cadence should mirror your decision-making cadence. Put another way: how often are you making important operational decisions that depend on what you think will happen next?
If you're in a fast-moving business making weekly calls on hiring, ad spend, or inventory, you absolutely need a weekly or bi-weekly forecast. A monthly number would be stale on arrival and practically useless for making those kinds of calls.
But for more stable businesses with longer sales cycles or multi-quarter project timelines, a monthly forecast with a deeper review each quarter is probably all you need. The goal is alignment. Don't forecast just for the sake of it—do it to give your most critical decisions the timely, relevant data they deserve.
Can We Improve Accuracy Without Dropping a Ton of Money on AI Tools?
You bet. In fact, you almost always get the biggest, fastest wins by mastering the fundamentals, not by throwing fancy tech at the problem. It's one of the biggest surprises for teams just starting this journey.
The most powerful levers you can pull are usually the simplest:
- Clean Your Data: A disciplined process for keeping your CRM and financial systems tidy will have an outsized impact.
- Standardize Your Process: Getting everyone to use the same objective criteria for things like pipeline stages is a game-changer for consistency.
- Create Feedback Loops: A recurring forecast variance meeting where you dissect what went right and wrong builds a culture of learning and continuous improvement.
Think of it this way: a simple, well-maintained statistical model will crush a powerful AI that's being fed garbage data. AI and other advanced tools are incredible accelerators, but they're what you add after you have a solid foundation, not a substitute for it. The real secret to improving forecast accuracy starts with your process and data discipline.
Ready to eliminate the manual data entry that sabotages your forecasts? TimeTackle automatically captures critical activity data from your team's calendars, giving you a complete and accurate picture of the effort behind your pipeline. See how you can build more reliable forecasts at https://www.timetackle.com.