Effective marketing agency reporting is all about translating raw campaign data into a clear, compelling story for your clients. It’s not about dumping a bunch of metrics into a spreadsheet. It’s about creating a strategic narrative that proves your value, justifies their investment, and—most importantly—guides what you’ll do next.
Think of it as the critical link between the daily grind at your agency and the client's big-picture business goals.
Why Your Current Agency Reporting Is Broken
Let’s be honest. For many agencies, the reporting process is a silent killer of both productivity and profit. It's a soul-crushing cycle of chasing down data, fighting with spreadsheets, and burning hours to format reports that clients barely even glance at.
This isn't just an inconvenience; it's a fundamental flaw in the business model that stunts your growth and puts client relationships at risk.

This old-school approach creates a tangled mess. Your team’s most valuable (and expensive) hours are spent on low-impact admin work instead of the high-level strategy and creative thinking clients actually pay you for. It’s a classic case of poor resource allocation—one of the most common problems in time management that keeps agencies stuck.
The Problem of Disconnected Data
The real damage comes from data living in silos. Your Google Ads data doesn’t talk to your HubSpot lead data, and neither of them connects to what your team is logging in Asana. You’re left trying to piece together a fragmented, confusing puzzle.
Sure, you can show off an impressive click-through rate, but can you draw a straight line from that ad spend to a closed deal? For most, the answer is no. This disconnect makes it nearly impossible to deliver the kind of strategic insights that turn your agency from just another vendor into an indispensable partner.
The result? Your reports become a rearview mirror, only showing what already happened. Clients today demand a GPS that shows them where they are, where they're going, and the best route to get there. Manual reporting simply can't provide that forward-looking guidance.
This isn't just a hypothetical drain on your resources. The 2023 Agency Benchmarks Survey from AgencyAnalytics revealed that 74% of agencies reported revenue growth, a trend directly linked to smarter strategies like ditching manual processes. With over 7,000 agencies already automating their reporting, clinging to spreadsheets means you’re actively choosing to fall behind.
Curious about what’s next? Check out the full report on marketing agency growth predictions.
Let's look at what this really costs you day-to-day.
The True Agency Cost of Manual vs Automated Reporting
| Aspect | Manual Reporting (The Old Way) | Automated Reporting (The Modern Approach) |
|---|---|---|
| Team Time | 10-20+ hours per client per month on data collection and formatting. High-cost employees doing low-value work. | 1-2 hours per client per month for setup and review. Frees up strategists to focus on analysis and client growth. |
| Data Accuracy | High risk of human error from copy-pasting. Inconsistencies erode client trust. | Data is pulled directly from the source via APIs. 99.9% accuracy is the standard. |
| Strategic Value | Reports are historical and reactive. "Here's what happened last month." | Dashboards are live and forward-looking. "Here's what's happening now, and what we should do next." |
| Client Perception | Seen as a basic vendor delivering a static PDF. Easily replaceable. | Perceived as a strategic partner providing live insights and proactive guidance. |
| Scalability | Every new client adds a significant reporting burden, capping growth potential. | Minimal extra effort per new client. Reporting scales effortlessly as your agency grows. |
| Profit Margin | High labor costs for reporting eat directly into project profitability. | Lower overhead for reporting leads to healthier margins on every client account. |
The table makes it painfully clear: sticking with manual reporting isn't just inefficient, it’s a direct hit to your bottom line and your ability to compete.
From Frustration to Inefficiency
When your best people are bogged down by mind-numbing data entry, the consequences ripple through the entire agency. This tedious work leads to "timesheet fatigue," where the administrative burden feels heavier than the actual marketing work.
This doesn't just crush morale; it opens the door to costly human errors and inaccurate reports that can permanently damage a client's trust.
Every hour spent copying and pasting data is an hour not spent on:
- Strategic Planning: Digging into competitor strategies or finding new market opportunities for your clients.
- Creative Innovation: Brainstorming that next breakthrough campaign.
- Client Relationships: Getting on a proactive call to discuss their long-term business goals.
This broken system forces your team to be reactive, always playing catch-up with last month’s data instead of proactively driving next month’s results.
The rest of this guide is a playbook for dismantling this inefficient process. We’ll walk through how to build a smart, automated reporting engine that fuels both client satisfaction and sustainable agency growth.
Choosing KPIs That Actually Matter to Clients
Let’s be honest. Vanity metrics are the first thing agencies learn to ditch. A huge follower count or a spike in website traffic looks great on the surface, but those numbers don't pay your client's bills. If you want to prove your agency's real value, your reporting has to connect directly to tangible business outcomes.
The goal is to completely change the conversation. You need to shift from reporting on what you did to what you achieved. It’s about speaking your client’s language—the language of revenue, growth, and return on investment.
Aligning Metrics with Business Goals
Every client is different, and so are their objectives. A creative agency running a brand awareness campaign for a new energy drink will measure success completely differently than a performance marketing shop driving leads for a B2B software company. One is tracking asset engagement and share of voice; the other lives and dies by lead velocity and customer acquisition cost.
Your reports have to reflect that reality. Before you even think about building a dashboard, sit down with your client and get crystal clear on what success actually looks like for them.
- Always Ask "Why?": When a client says they want more traffic, ask them why. Do they need more leads? Are they trying to boost online sales? Is the goal to build an email list? Keep digging until you hit a core business objective.
- Connect Everything to Revenue: Frame your KPIs in a way that shows their impact on the bottom line. Don't just report 50,000 impressions. Instead, show how those impressions led to 500 clicks, which generated 50 qualified leads, and ultimately closed 5 new customers.
- Use Their Language: If they talk about "pipeline," "deal flow," or "average order value" in their board meetings, those are the exact terms that need to be front and center in your reports.
Getting this alignment right has never been more critical. Confidence in measuring ROI is shockingly low, which creates a huge opportunity for agencies that can nail it. According to the 2023 Nielsen Annual Marketing Report, only 54% of global marketers are confident in their ROI measurement, even though 64% expect their budgets to go up. This gap is your chance to stand out with reporting that clearly links your work to their financial success.
The Three Pillars of Meaningful KPIs
A truly compelling report tells a complete story. To do that, I've found it helps to group KPIs into three distinct categories. This framework gives you a balanced view that covers immediate results, long-term campaign health, and your own agency's efficiency.
Think of your report as a story. The performance KPIs are the climax, the progress KPIs are the rising action building suspense, and the profitability KPIs are the behind-the-scenes notes that show how the whole production came together smoothly.
Let's break down these pillars.
1. Performance KPIs (The "What")
These are the heavy hitters—the bottom-line metrics that directly measure the financial impact of your work. They should be the headline of every single client report, no exceptions.
- Cost Per Acquisition (CPA): How much are we spending to land one new customer?
- Return on Ad Spend (ROAS): For every dollar we put into ads, how much revenue are we getting back?
- MQL to SQL Conversion Rate: How good are we at turning initial interest into a real sales opportunity?
- Customer Lifetime Value (CLV): What’s the total revenue we can expect from a single customer over time?
2. Progress KPIs (The "How")
These are your leading indicators. They show the momentum you're building and provide context for the performance KPIs. They prove that your campaigns are healthy and are on track to deliver future results.
- Organic Traffic Growth: Is our content and SEO strategy consistently bringing in more qualified visitors?
- Campaign Milestones: Are we hitting key project deadlines, like launching that new landing page or finishing the creative asset library?
- Lead Velocity Rate (LVR): Is our pipeline of qualified leads growing month-over-month?
- Audience Engagement Rate: Are people actually interacting with our content in meaningful ways (likes, shares, comments, saves)?
3. Profitability KPIs (The "Why It's Worth It")
These are typically for internal use, but sharing a few of them strategically can reinforce your value and show off your agency's efficiency. These numbers ensure the relationship is sustainable and profitable for you, which is key to a long-term partnership. Tracking these properly is just good project management. If you want to go deeper, there are plenty of other metrics in project management that can help you build a more powerful internal dashboard.
- Client-Level Gross Margin: After all our costs, is this account actually profitable for the agency?
- Team Utilization Rate: Are we dedicating the right amount of time to this client—not over-servicing them into the ground or under-delivering on our promise?
When you structure your reporting around these three pillars, you stop just presenting data points. Instead, you start telling a strategic story focused on mutual growth, turning your agency from a vendor into a true partner.
Designing Dashboards That Actually Tell a Story
A great report isn't just a data dump—it's a story. The best marketing agency reporting takes raw numbers and weaves them into a clear narrative about progress, challenges, and what’s coming next. The trick is realizing you’re not building one dashboard; you’re designing for two totally different audiences: your clients and your own team.
For your clients, the dashboard is a direct window into the value of their investment. For your internal team, it's a mirror reflecting the health and profitability of your operations. Nailing both is absolutely fundamental to growing your agency without burning out.
Crafting Client-Facing Dashboards
When a client logs in to see their report, they really only have one question on their mind: "Is this working?" Your dashboard has to answer that question instantly.
Simplicity is your best friend here. Fight the urge to show off every single metric you're tracking. Instead, focus on a logical flow that starts with the big picture and then drills down into the details. This approach respects their time while giving them the confidence they need in your partnership.
Here’s a practical structure I’ve seen work wonders:
- The Executive Summary: This is the first thing they see, so it has to be crystal clear. Feature the 3-5 most important KPIs you agreed on—think ROAS, new leads, or cost per acquisition. Use big, bold scorecards or gauges for an immediate, at-a-glance read on performance versus goals.
- Performance Deep Dives: Just below the summary, create sections for each main channel you're managing, like Google Ads, SEO, or Social Media. This is where you can show supporting metrics like click-through rates or organic traffic growth. The key is to always tie these numbers back to the main goals you highlighted up top.
- Key Insights & Next Steps: This is where you answer the "so what?" question. It doesn't have to be long. Just a simple, plain-language analysis like, "We saw a 15% drop in CPA this month because the new ad creative really connected with our target audience. Next month, we're shifting more budget to this winning campaign."
This screenshot from TimeTackle is a great example of presenting complex data in a clean, intuitive way.
See how it uses clear visuals and organized sections? That's exactly what you want. It makes the information easy to digest, which is the whole point of a good client report.
Building Internal Dashboards for Operational Excellence
While client dashboards look outward to prove value, your internal dashboards look inward to protect your profitability. Think of this as your agency's command center, built for your ops managers, project leads, and finance team. The goal isn't a simple story; it's a dynamic, filterable view of your most precious resource: your team's time.
Your internal reporting needs to zero in on the operational health metrics that clients never see but are absolutely critical for making smart business decisions.
An internal dashboard's main job is to flag problems before they blow up. Is a project about to go over budget? Is a team member completely overloaded? Is that client who looks profitable on paper actually a massive time-sink? Your data should give you these answers proactively.
Here are the must-have components for a solid internal dashboard:
- Team Utilization: You need to track billable vs. non-billable hours for every single person and for the agency as a whole. A good target to aim for is 75-85% utilization. This keeps your team productive without pushing them toward burnout.
- Project Profitability: It's time to move beyond just looking at revenue. You need to know your gross margin on every project. By connecting time tracking data from a tool like TimeTackle to your project budgets, you can see in real-time which clients are your cash cows and which might need a price bump at renewal.
- Resource Allocation: Get a bird's-eye view of who is working on what. A good dashboard lets you filter by employee, client, or project, making it ridiculously easy to see who has the bandwidth for a new project and who is stretched thin. This data is pure gold for staffing and hiring decisions.
- Scope Creep Alerts: Set up visuals that track hours logged against the initial project scope. This gives your project managers an early warning system, allowing them to spot potential overages and have a data-backed conversation with the client about adjusting the scope or budget.
By splitting your reporting into these two distinct streams, you build a system that meets your clients' need for clarity and your agency's need for control. As you design these, don't forget how important good visuals are. It's worth exploring some data visualization best practices to make sure your dashboards are as powerful as they can be.
How to Automate Data Capture Without Timesheets
The biggest headache in agency reporting? Getting accurate data on where your team’s time actually goes. Let’s be honest, traditional timesheets are a well-intentioned failure. They’re a pain to fill out, wildly inaccurate, and a universal source of dread for creative and strategic teams.
It’s time to kill the timesheet for good.
The modern approach flips the script. Instead of asking your team to guess where their hours went at the end of the week, you automatically capture their activity as it happens. You do this by connecting the tools they already live in every day—like Google Calendar, Outlook, and your CRM—to a central reporting hub.
The Power of Rule-Based Automation
The magic behind this is rule-based automation. It's a simple concept: you create "if-then" rules that automatically tag and categorize every minute your team spends on work. It’s a set-it-and-forget-it system that quietly gathers pristine data in the background.
For example, a project manager can set up a rule that says: "If a calendar event includes the keyword 'Client A,' automatically tag it to the 'Client A Q3 Campaign' project."
Just like that, every client meeting, internal strategy session, and block of focused work for that client gets categorized correctly. This data flows right into your utilization and profitability reports, giving you a real-time pulse on your agency's health without a single manual entry.
The goal isn't just to track time; it's to understand effort and investment. Automated data capture gives you a true, unbiased record of how your agency's most valuable resource—your team's expertise—is being allocated across your entire client portfolio.
This kind of robust, automated data capture is also a massive driver of agency valuation. Valuations often hinge on proving predictable growth and recurring revenue. According to Productive.io's 2023 Global Data Report, over half of the 796 businesses surveyed have more than 50% recurring revenue—a key metric for any potential buyer. By automating data capture, you produce the clean utilization and profitability data needed to prove that stability, making your agency far more attractive. You can learn more about how data impacts agency business valuations.
Connecting Your Core Tools
To make this system hum, you need to sync your primary work management platforms. This integration pulls data from where the work actually happens, creating a single source of truth.
- Calendar Integration (Google & Outlook): This is the foundation. Since most meetings and scheduled work blocks live on the calendar, this integration captures the bulk of your team’s planned activities automatically.
- CRM Integration (e.g., HubSpot, Salesforce): Connecting your CRM lets you tie time spent directly to sales opportunities, client accounts, or specific deals. This is how you start measuring the true cost of sales and client management.
- Project Management Integration (e.g., Asana, Jira): Syncing with your project management tool links time data to specific tasks and deliverables, giving you granular insight into project progress and budget burn.
This flow diagram shows how this all comes together, funneling data from different sources into structured, insightful reports.
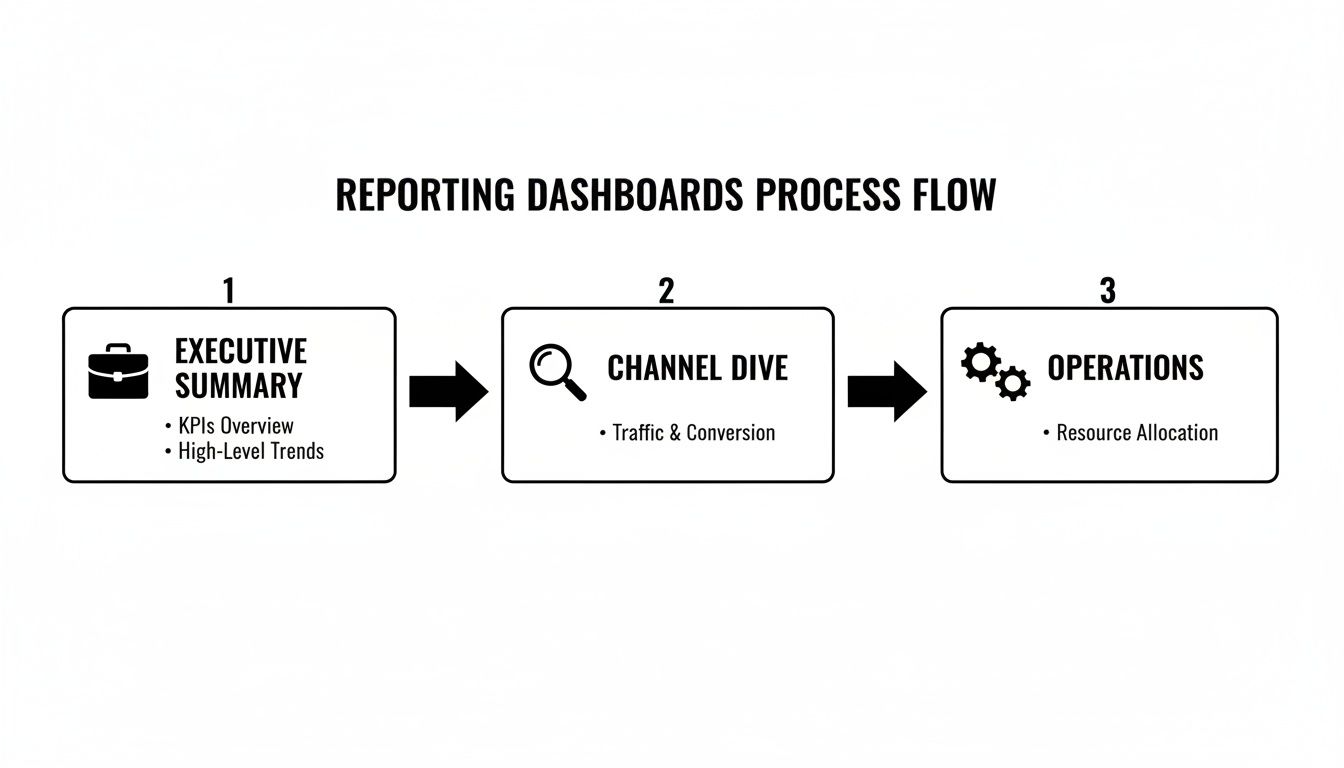
This kind of clear pathway—from a high-level executive summary down to detailed operational metrics—is only possible when you’re working with clean, integrated data.
Smart Tagging for Effortless Accuracy
Even with fantastic automation, ad-hoc tasks will always pop up. This is where smart tagging tools, often available as simple Chrome extensions, come in.
Instead of navigating to a clunky form, a team member can tag an activity on the fly with just a couple of clicks. The best tools even suggest tags based on the event title, attendees, or linked documents, making the process almost instant.
Imagine a designer wraps up a new ad creative. A small pop-up appears, suggesting tags like "Client B" and "Social Media Campaign." They click to confirm, and the data is captured. This simple workflow finally solves the industry-wide problem of timesheet fatigue by making data capture a natural part of the daily routine, not a dreaded end-of-week chore.
Tying It All Together: Your Reporting and Billing Workflows
Once you have clean, automatically captured data, you’ve honestly done the hardest part. The next step is putting that information to work. This is where you turn simple data points into powerful drivers for both client satisfaction and your agency's bottom line.
It's all about creating seamless, repeatable workflows for reporting and billing that finally connect your team's day-to-day effort with your revenue. This process gets rid of the constant friction between your team, your clients, and your finance department. No more debates over billed hours versus perceived value. The goal is a single source of truth that guarantees accuracy and builds that unbreakable trust with clients.

Set Up Automated Reporting Cadences
Great marketing agency reporting is all about consistency. Clients need predictable, timely updates, and your team needs a process that doesn't involve reinventing the wheel every single month. Visual workflow builders are perfect for this, letting you create automated sequences that run like absolute clockwork.
Think about it: you can set up a workflow that gets triggered by the "end of a billing period." From there, it could automatically:
- Generate a performance report from a pre-defined template for a specific client.
- Pull in all the tagged and categorized time and activity data for that period.
- Send the report as a PDF to the client's main contact and a quick summary to your internal account manager.
This isn't just about saving time. It’s about delivering a professional, consistent experience that reinforces your agency's reliability and sharp attention to detail.
The real magic of automated reporting is that it frees your strategists from soul-crushing admin. Instead of spending the first three days of every month building reports, they can spend that time actually analyzing the data and preparing strategic recommendations for the client call.
This shift from data wrangler to strategic advisor is what separates the good agencies from the great ones. It ensures your most valuable people are focused on high-impact work that directly contributes to client retention and growth.
Sync Data for Flawless Invoicing
The final, crucial piece of the puzzle is linking your operational data directly to your billing system. This closes the loop between the work your team does and the revenue your agency earns, making sure you bill accurately for every single minute of effort.
Modern reporting hubs give you a few ways to make this connection seamless. You can filter your categorized time data by client, project, or date range and then spit it out in whatever format your finance team needs.
A few common workflows we see are:
- Direct Export to Excel/CSV: The simplest method. This gives you a clean, itemized list of billable activities ready to be imported into any accounting software.
- Google Sheets Sync: A live, two-way sync is a great option. It keeps a Google Sheet constantly updated with the latest time data, which is perfect for a collaborative review before the invoices go out.
- API Integration: For larger agencies, connecting your reporting hub directly to your billing platform via API automates the whole shebang, from data capture straight through to invoice generation.
For any ops leader, this kind of integration is non-negotiable. It provides an unshakeable foundation for your financial health, eliminating those common discrepancies that lead to client disputes and revenue leakage. For a deeper look at optimizing an agency's financial operations, it's worth exploring how professional accounting and bookkeeping services can structure these critical processes.
Ultimately, by building these streamlined workflows, you transform your reporting from a monthly chore into a genuine strategic asset. You’re creating a system that not only proves your value to clients but also shores up the financial integrity and operational efficiency of your entire agency.
Got Questions About Agency Reporting? We've Got Answers.
Moving away from clunky spreadsheets and into a more strategic, automated reporting model is a big shift. It's totally normal for questions to pop up. It’s a change in process and mindset, but trust me, navigating it is simpler than you think. Let's walk through the most common questions we hear from agencies just like yours.
The whole point is to ditch the old-school methods for a system that actually proves your agency’s value—both to your clients and your own team.
How Often Should My Agency Send Reports to Clients?
There’s no magic number here. The right reporting cadence really depends on the client, how fast the campaign is moving, and the goals you’ve set together. A high-spend PPC campaign probably needs near-real-time updates, while a long-game content strategy is better served with a thoughtful monthly review.
The most critical part is to set clear expectations right from the start. What works brilliantly is a layered approach, which keeps clients in the loop at different frequencies without bogging your team down with extra work.
Here’s what that looks like in practice:
- Real-Time Dashboard: Give clients read-only access to a live dashboard. This builds incredible trust and lets them get quick answers whenever they want, reducing one-off "how are things going?" emails.
- Weekly Email Summary: Set up an automated email that pings their inbox every Monday morning with a snapshot of the top 3-5 KPIs. It’s a simple way to keep your results top-of-mind.
- Monthly Strategic Call: Use a more detailed monthly report as the agenda for a forward-looking strategy session. This is where you connect the dots, discuss what's next, and reinforce your value.
Automation is the secret sauce that makes this all manageable. You can deliver constant value and communication without adding a single billable hour to the project.
How Do I Report on Both Activity and Outcomes?
Nailing this is probably the single most important skill in proving your agency's worth. The trick is to structure your reporting narrative to always lead with the outcomes and then use activities as the supporting evidence. This shift in framing positions you as a strategic partner, not just a task-doer.
Kick off your reports with the numbers your client actually cares about: revenue generated, qualified leads, or cost per acquisition. Those are the outcomes. Then, bring in the activity metrics to explain exactly how you made those results happen.
Don’t just show them the final score. Show them the game-winning plays that led to it. An outcome without context is just a number; an outcome with context is a success story starring your agency.
For example, instead of just listing tasks, frame it like this:
"This month, we generated 50 new Marketing Qualified Leads (the outcome). We drove this by achieving a 20% increase in landing page traffic from our new ad campaign (an activity) and a 5% improvement in form submission rates after A/B testing the headline (another activity)."
This simple structure instantly shows you understand cause and effect. It elevates the conversation from a checklist of things you did to a strategic breakdown of what's driving real business growth.
How Do I Get My Team to Adopt a New Reporting Process?
Getting the team on board can make or break any new process, and reporting is no different. The biggest hurdle is almost always the perception that you're just piling on more admin work. The secret is to frame the new process around what's in it for them.
Focus on how it makes their lives easier, not just how it helps the agency. For instance, emphasize that an automated data capture system means no more manual timesheets. That one benefit is often enough to win over even the biggest skeptics.
From there, you can show them how clear, accurate data on team utilization helps prevent burnout. When you can see that a project is under-scoped from the start, you can protect your team's time. Nobody wants to be overworked.
Here’s a simple game plan for a smooth rollout:
- Start with a Pilot Group: Grab a few of your most enthusiastic team members and let them test the new process. They'll help you iron out any kinks and can become internal champions who vouch for its benefits to everyone else.
- Keep Training Short and Sweet: Don't overwhelm them with a two-hour deep dive. Focus the training on how the system makes their specific jobs easier and frees them up for the creative, strategic work they actually enjoy.
- Celebrate Early Wins: The first time the new system helps you flag a scope creep issue or justifies a budget increase for a client, share that win with the whole team. Show them it's already working.
When you position the new reporting process as a tool that empowers them, you'll turn potential resistance into active support.
Ready to kill the timesheet and build a reporting engine that fuels growth? TimeTackle provides the AI-powered platform to automate data capture from your team's calendars and tools, giving you the real-time insights you need to improve profitability and client satisfaction. See how it works at https://www.timetackle.com.