In a world drowning in data, a well-designed performance dashboard is your lifeline. It transforms raw numbers into a clear, actionable story about your business's health, cutting through the noise of endless spreadsheets and manual reporting overhead. But how do you create a dashboard that teams will actually use? The secret isn't just about choosing the right charts; it's about strategic layout, focused metrics, and a relentless commitment to clarity. A great dashboard moves a team from simply viewing data to engaging in effective data-driven decision making.
This guide moves beyond theory to dissect 7 real-world performance dashboard examples, from specialized productivity tools like TimeTackle to comprehensive BI platforms like Tableau and Power BI. For each example, we provide a deep strategic analysis, breaking down the layout choices and key metrics that make them effective. You'll find direct links and screenshots, along with specific, replicable methods you can apply immediately. Our goal is to equip you with the insights needed to build dashboards that don't just report data, they drive decisive action and improve operational efficiency.
1. TimeTackle
TimeTackle distinguishes itself with a calendar-first approach to performance management, transforming a team's daily schedule into a dynamic, automated data source. Instead of relying on manual timesheets, the platform integrates directly with Google and Outlook calendars to capture activities, providing an exceptionally low-friction method for tracking time, utilization, and project ROI. This makes it a powerful choice for organizations aiming to eliminate administrative overhead while gaining deep, real-time operational insights.
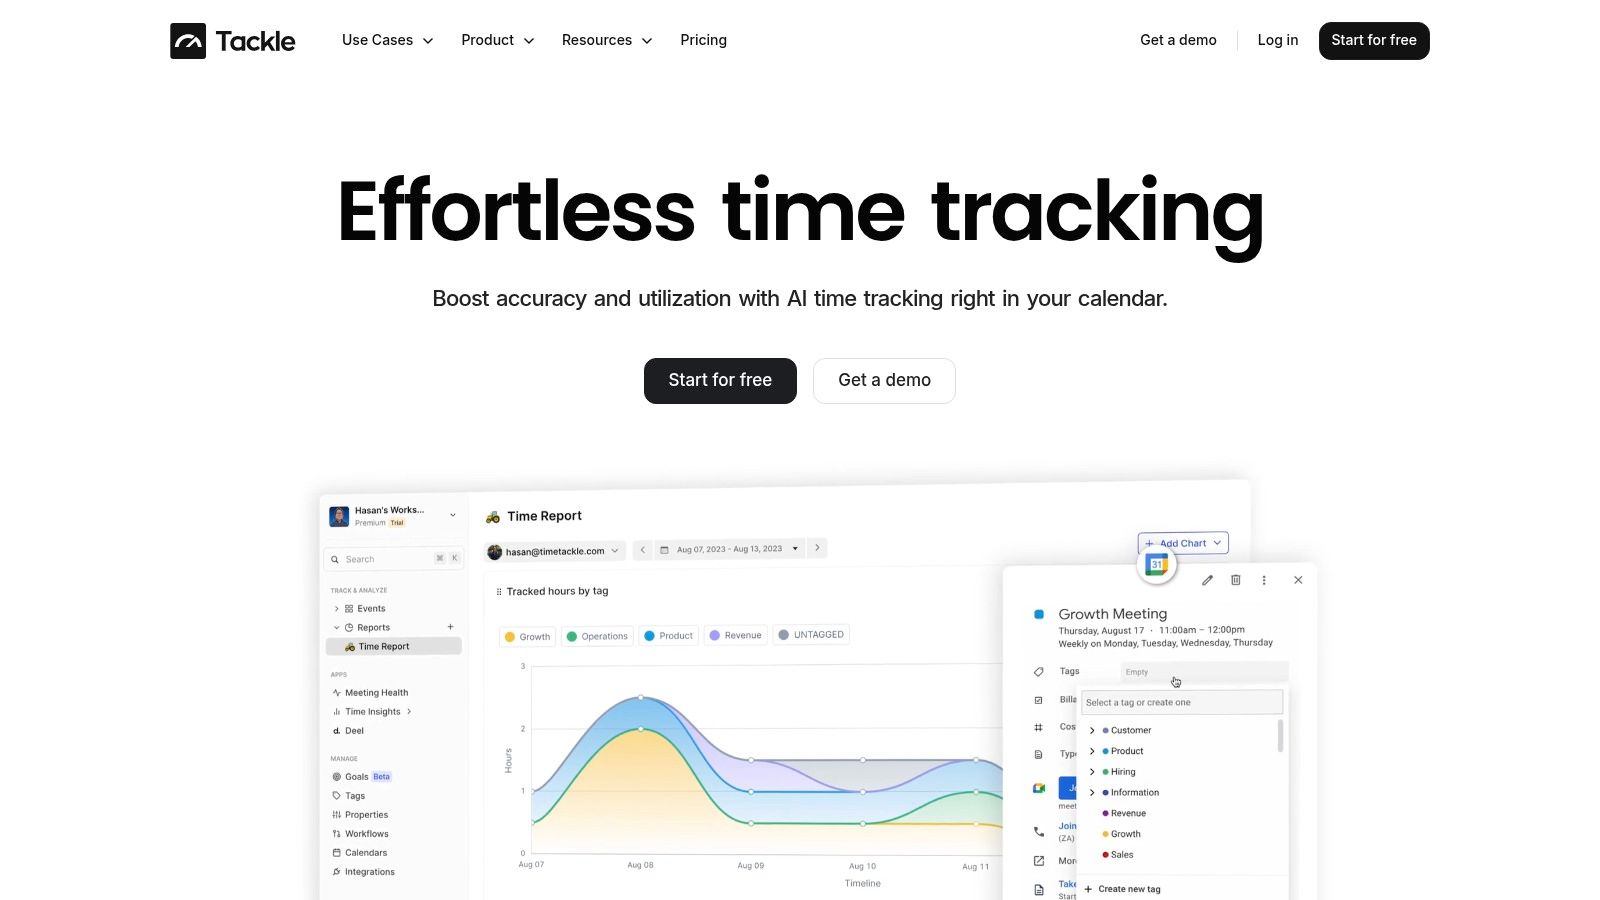
The platform’s strength lies in its ability to surface critical business metrics directly from existing workflows. Its performance dashboard examples are particularly effective for service-based businesses like agencies, consulting firms, and customer-facing teams who need to understand resource allocation with precision.
Strategic Analysis & Key Features
TimeTackle’s dashboards are built for strategic decision-making, not just passive reporting. The design prioritizes clarity and actionability, allowing leaders to quickly identify trends in team productivity, project profitability, and resource utilization.
- Automated Data Capture: By syncing with calendars, TimeTackle removes the primary pain point of time tracking: manual entry. This automation not only saves countless hours but also improves data accuracy, as it reflects how time was actually scheduled.
- AI-Powered Categorization: The system uses AI to suggest tags and classifications for calendar events, further reducing manual effort. Users can also set up rule-based automations to categorize recurring activities, ensuring consistent and structured data for analysis.
- Flexible & Dynamic Dashboards: The dashboards are highly customizable. Leaders can filter and segment data by team, client, project, or custom tag, allowing them to answer specific business questions like, "How much time did our pre-sales team spend on a key account last quarter?" or "Which projects are consuming the most engineering resources?"
- Robust Reporting & Integration: Beyond the dashboard, data can be exported to Excel/CSV/PDF, synced with Google Sheets, or pushed via API and data warehouse integrations. This flexibility is crucial for billing, invoicing, and deeper business intelligence analysis.
Actionable Takeaways & Practical Use Cases
What sets TimeTackle apart is its practical application across various roles. It bridges the gap between daily activities and high-level strategic goals, making it a standout among performance dashboard examples.
Key Insight: The most effective performance dashboards are those that integrate seamlessly into existing workflows. TimeTackle’s calendar-first model is a prime example of reducing friction to increase data quality and adoption.
How to Leverage TimeTackle for Better Performance:
- For Agency Operations: Use the dashboard to monitor billable vs. non-billable hours across clients. Identify scope creep early by visualizing which projects are consistently exceeding their allocated time.
- For Sales & Pre-Sales Teams: Track the time investment required to close deals. Analyze the ROI of customer-facing activities to optimize sales cycles and resource allocation for high-value opportunities.
- For Executive Leadership: Gain a holistic view of organizational efficiency. Use utilization reports to inform strategic planning, hiring decisions, and identify opportunities for process improvement in hybrid work environments.
While pricing is not publicly listed, TimeTackle offers a free trial and personalized demos, allowing teams to assess its fit before committing. Its enterprise-grade security, including SOC 2 Type II certification, makes it a trusted solution for over 300 teams seeking to build a culture of data-driven performance.
Website: https://www.timetackle.com
2. Tableau Exchange – Accelerators
Why build from scratch when you can build on success? Tableau Exchange offers a treasure trove of pre-built "Accelerators" that provide a massive head start for anyone creating performance dashboard examples. Instead of just a static image, these are fully functional, downloadable Tableau workbooks designed by industry experts for common business scenarios like sales pipeline analysis, marketing campaign performance, and financial health overviews. This unique offering moves beyond inspiration into immediate application.
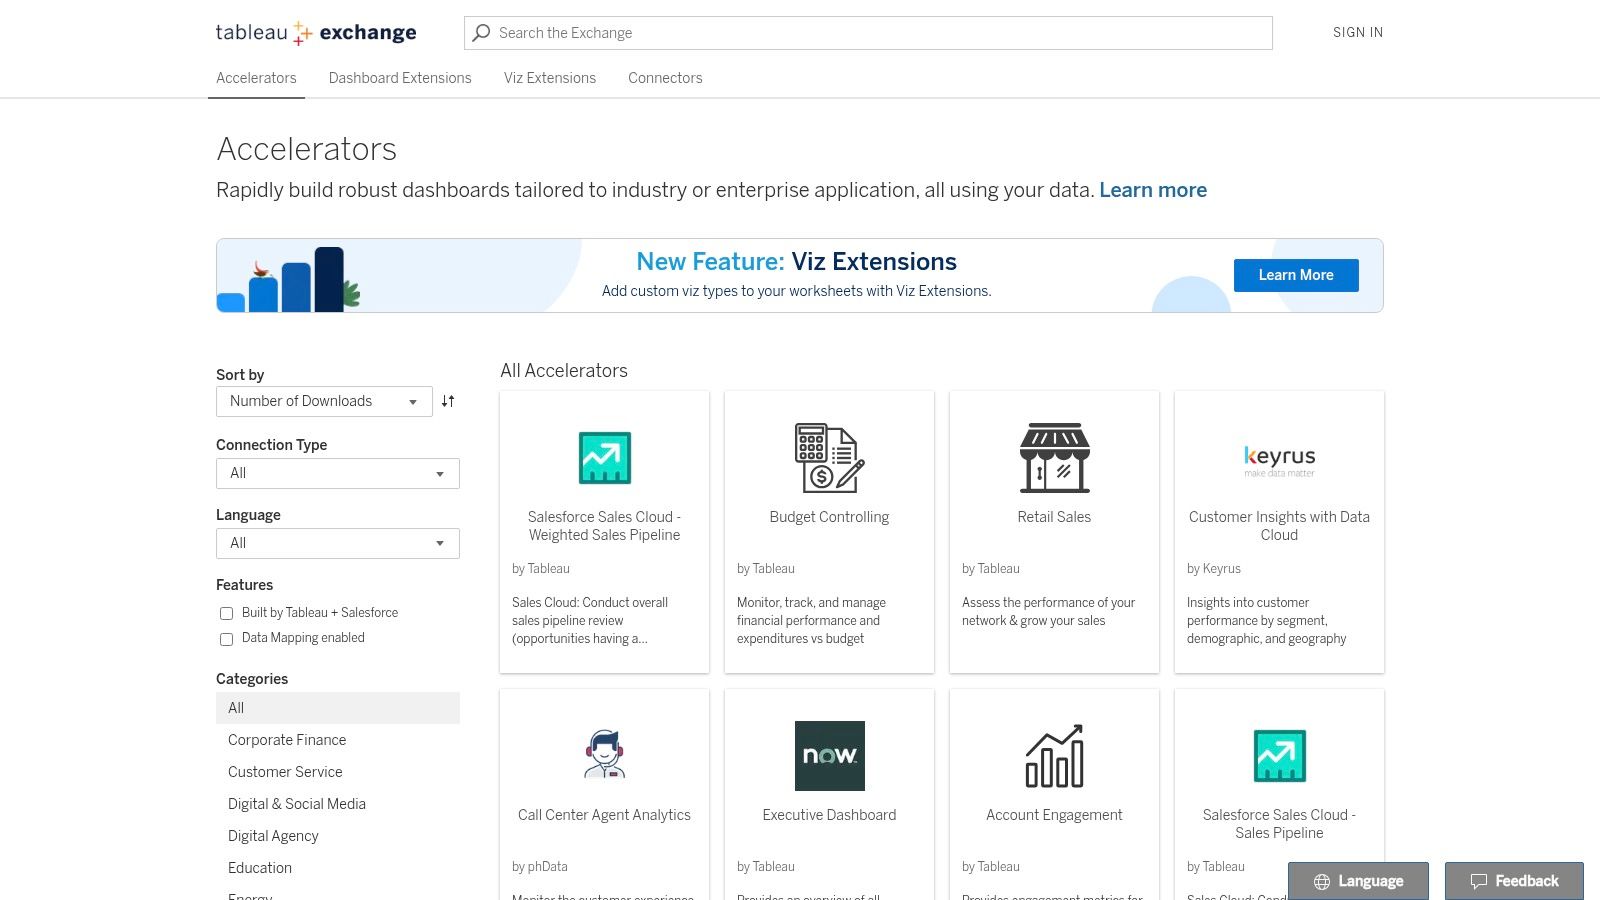
The primary strength of the Tableau Exchange is its focus on accelerating time-to-value. For a busy agency or consulting firm, this means you can bypass weeks of initial design and development. You can download an Accelerator, connect it to your data sources, and have a polished, best-practice dashboard ready for analysis in a fraction of the usual time.
Strategic Breakdown
Tableau’s approach is a masterclass in product-led growth and user enablement. By providing high-quality, free templates, they lower the barrier to entry for creating sophisticated analytics. These Accelerators not only solve immediate business needs but also serve as powerful learning tools. Users can reverse-engineer the dashboards to understand complex calculations, layout strategies, and effective data visualization.
Key Insight: The true value is not just the dashboard itself, but the embedded expertise. Each Accelerator is a blueprint of key performance indicators (KPIs) and metrics deemed essential by Tableau and its partners for a specific domain.
Actionable Takeaways
Pros:
- Rapid Deployment: Drastically cuts down development time for common dashboards.
- Best Practices Baked-In: Built by Tableau experts, ensuring high standards in design and usability.
- Broad Industry Coverage: Find templates for everything from supply chain logistics to healthcare patient analysis.
Cons:
- Software Dependency: Requires a Tableau license (Desktop or Cloud) to customize and use with your own data.
- Customization Skill Curve: Significant modifications may require intermediate to advanced Tableau proficiency.
To get the most out of this resource, use the filters to narrow down your search by industry or department. Before connecting your own data, explore the included sample data to understand the dashboard's structure and logic. Following these steps and implementing strong data visualization best practices will ensure your final product is both effective and insightful.
Website: Tableau Exchange – Accelerators
3. Microsoft Power BI – Data Stories Gallery (Community)
Where better to find real-world performance dashboard examples than from the community that builds them every day? The Microsoft Power BI Data Stories Gallery is a vibrant hub where practitioners, from seasoned analysts to aspiring data wizards, share their interactive reports. It offers a ground-level view of how people are actually using Power BI to solve tangible business problems, moving beyond polished corporate templates into practical, diverse applications.
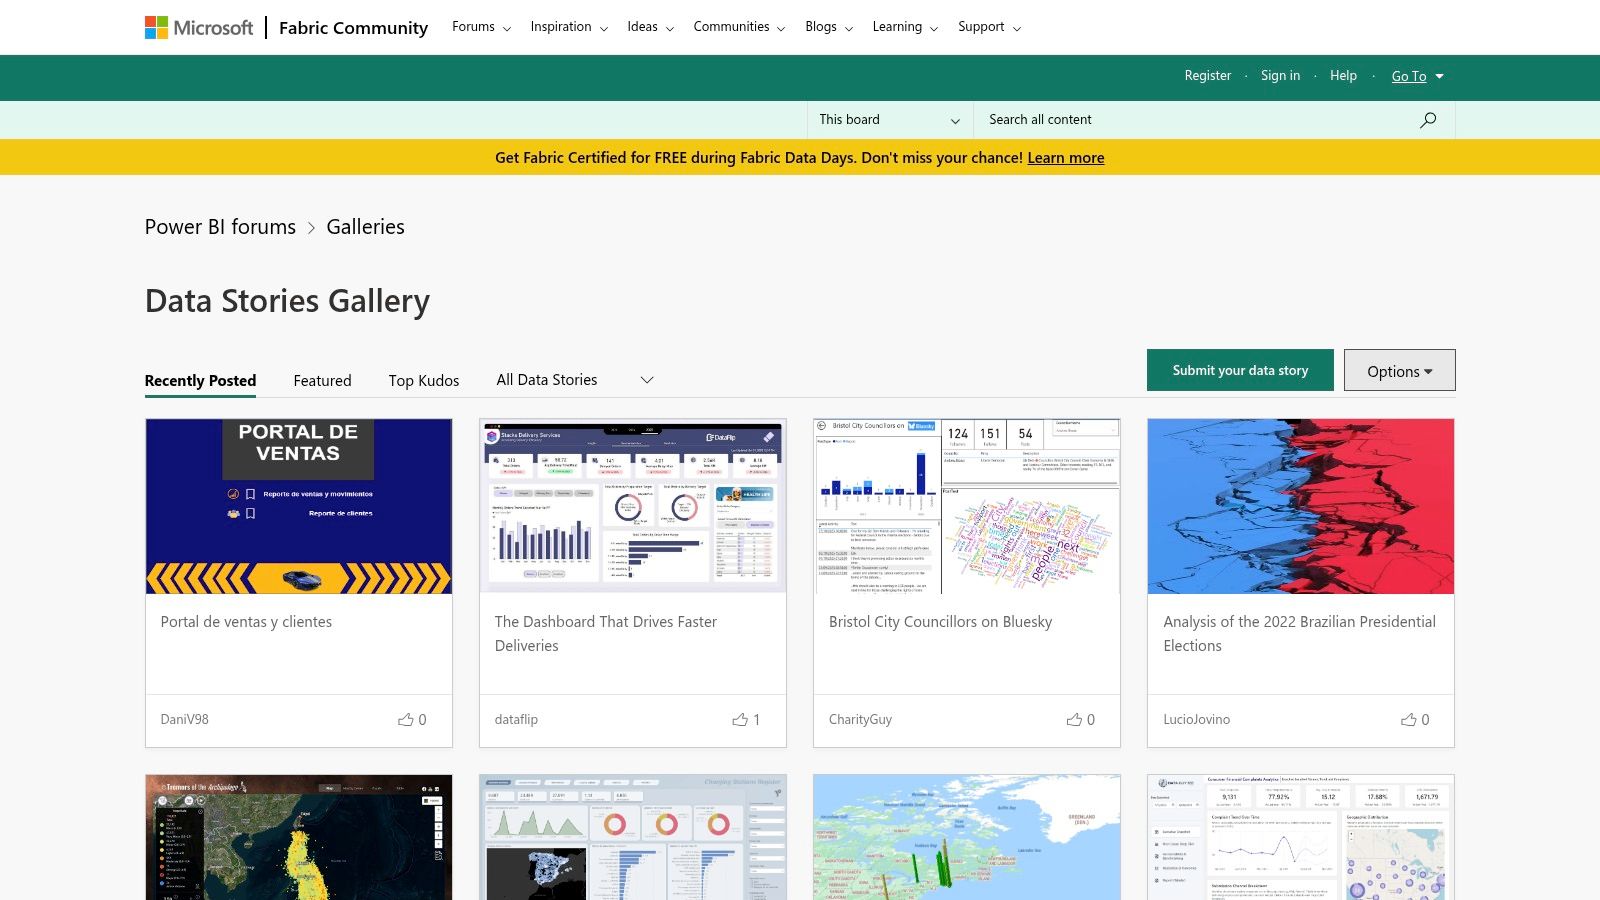
The gallery’s core value lies in its authenticity and diversity. You can find dashboards for virtually any industry or function, from analyzing sales commissions in a manufacturing company to tracking IT helpdesk tickets. This raw, community-driven approach provides a massive pool of creative layouts, novel chart usage, and clever DAX (Data Analysis Expressions) implementations that can inspire your own work.
Strategic Breakdown
Microsoft's strategy with the gallery is to foster a self-sustaining ecosystem of learning and inspiration. By giving users a platform to showcase their work, they encourage peer-to-peer education and organically highlight the platform's flexibility. This user-generated content serves as an ever-expanding library of use cases, demonstrating the tool's power far more effectively than any marketing material could.
Key Insight: The gallery is a direct line to the creative pulse of the Power BI community. It's less about finding a perfect, ready-to-use template and more about discovering innovative visualization techniques and data storytelling patterns you hadn't considered.
Actionable Takeaways
Pros:
- Real-World Application: Dashboards are created by actual users to solve real business challenges.
- Inspiration for Innovation: Discover unique design patterns and visualization ideas outside of standard templates.
- Completely Free: No cost to browse, interact with reports, or engage with the community of authors.
Cons:
- Variable Quality: As a community showcase, the quality and best-practice adherence can differ significantly between submissions.
- Downloads Aren't Guaranteed: Access to the source PBIX file is at the discretion of the original author.
To maximize this resource, filter submissions by keywords relevant to your industry, like "supply chain" or "HR analytics." Engage with the authors in the comments section to ask about their design choices or data modeling techniques; many are happy to share their knowledge. Use the gallery not for plug-and-play solutions, but as a visual brainstorming tool to spark new ideas for your next performance dashboard.
Website: Microsoft Power BI – Data Stories Gallery
4. Google Looker Studio – Template Gallery
For teams deeply embedded in the Google ecosystem, Looker Studio’s Template Gallery is the fastest path from data to decision. It offers a collection of ready-to-use performance dashboard examples designed specifically for core Google services like Google Analytics 4, Google Ads, Search Console, and YouTube Analytics. The standout feature is its seamless integration: you can copy a template, connect your own data source, and have a live, shareable report in minutes, all for free.
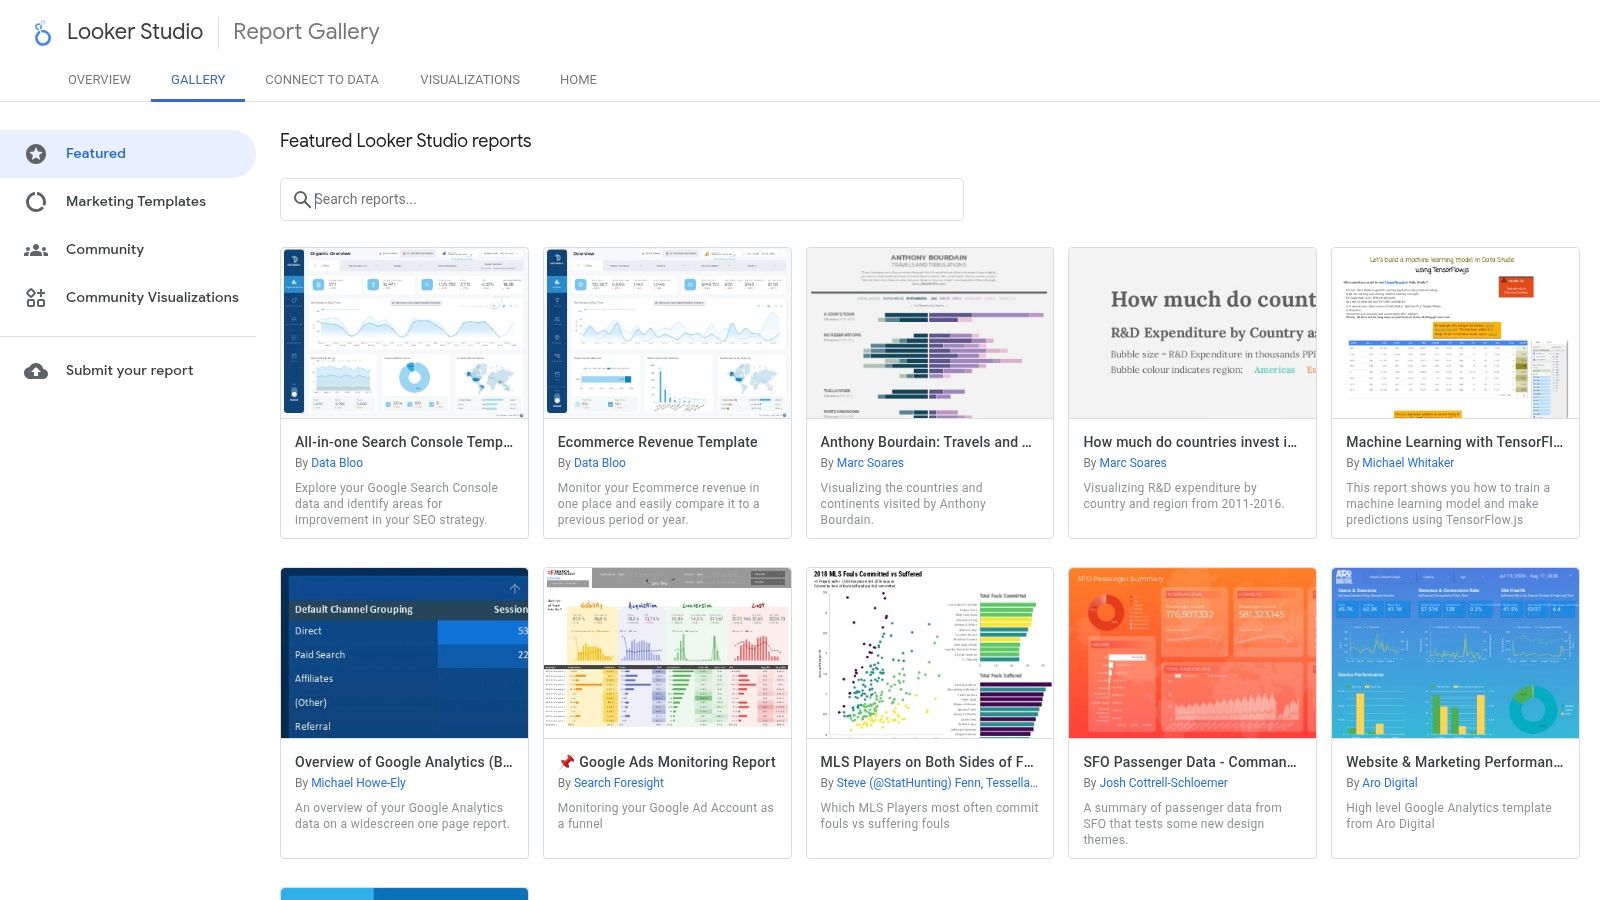
The primary strength of the Looker Studio Gallery is its accessibility and speed, particularly for marketing and web performance reporting. An agency can instantly generate a client-facing GA4 traffic overview or an internal Google Ads performance review without any setup cost or complex software installation. This makes it an incredibly efficient tool for standardizing reporting across multiple accounts or projects.
Strategic Breakdown
Google's strategy here is to create a frictionless analytics experience that keeps users within its ecosystem. By providing polished, official templates for its most popular data sources, Google removes the initial hurdle of report creation. This not only encourages wider adoption of Looker Studio but also reinforces the value of its entire data and advertising stack. The one-click copy flow is a masterstroke in user experience, prioritizing immediate utility over a steep learning curve.
Key Insight: The gallery is a powerful starting point, not just a final product. The templates serve as a foundation for best practices in marketing analytics, showing which KPIs and visualizations are most critical for understanding digital performance.
Actionable Takeaways
Pros:
- Zero-Cost Entry: Completely free to use with a Google account, making it highly accessible.
- Seamless Integration: One-click connection to Google data sources like GA4 and Google Ads.
- Rapid Setup: Go from template selection to a live, data-connected dashboard in under five minutes.
Cons:
- Google-Centric: Heavily biased towards Google's own data sources; connecting to non-Google data often requires third-party connectors.
- Template Dependent: The quality and variety of dashboards are limited to what is available in the gallery.
To maximize this resource, start by exploring the templates built by Google itself, as they often represent the most robust and well-structured designs. Use these as a base and then customize the branding, add commentary, and blend in data from other sources using available connectors to create a more comprehensive performance dashboard.
Website: Google Looker Studio – Template Gallery
5. Grafana Dashboards Library
For teams deep in the world of infrastructure and application monitoring, the Grafana Dashboards Library is the go-to resource. It offers a vast collection of pre-built dashboards, submitted by the community and Grafana Labs, designed specifically for observability. These aren't just conceptual performance dashboard examples; they are ready-to-import JSON models that instantly visualize data from sources like Prometheus, Loki, and InfluxDB, turning raw metrics into actionable operational insights.
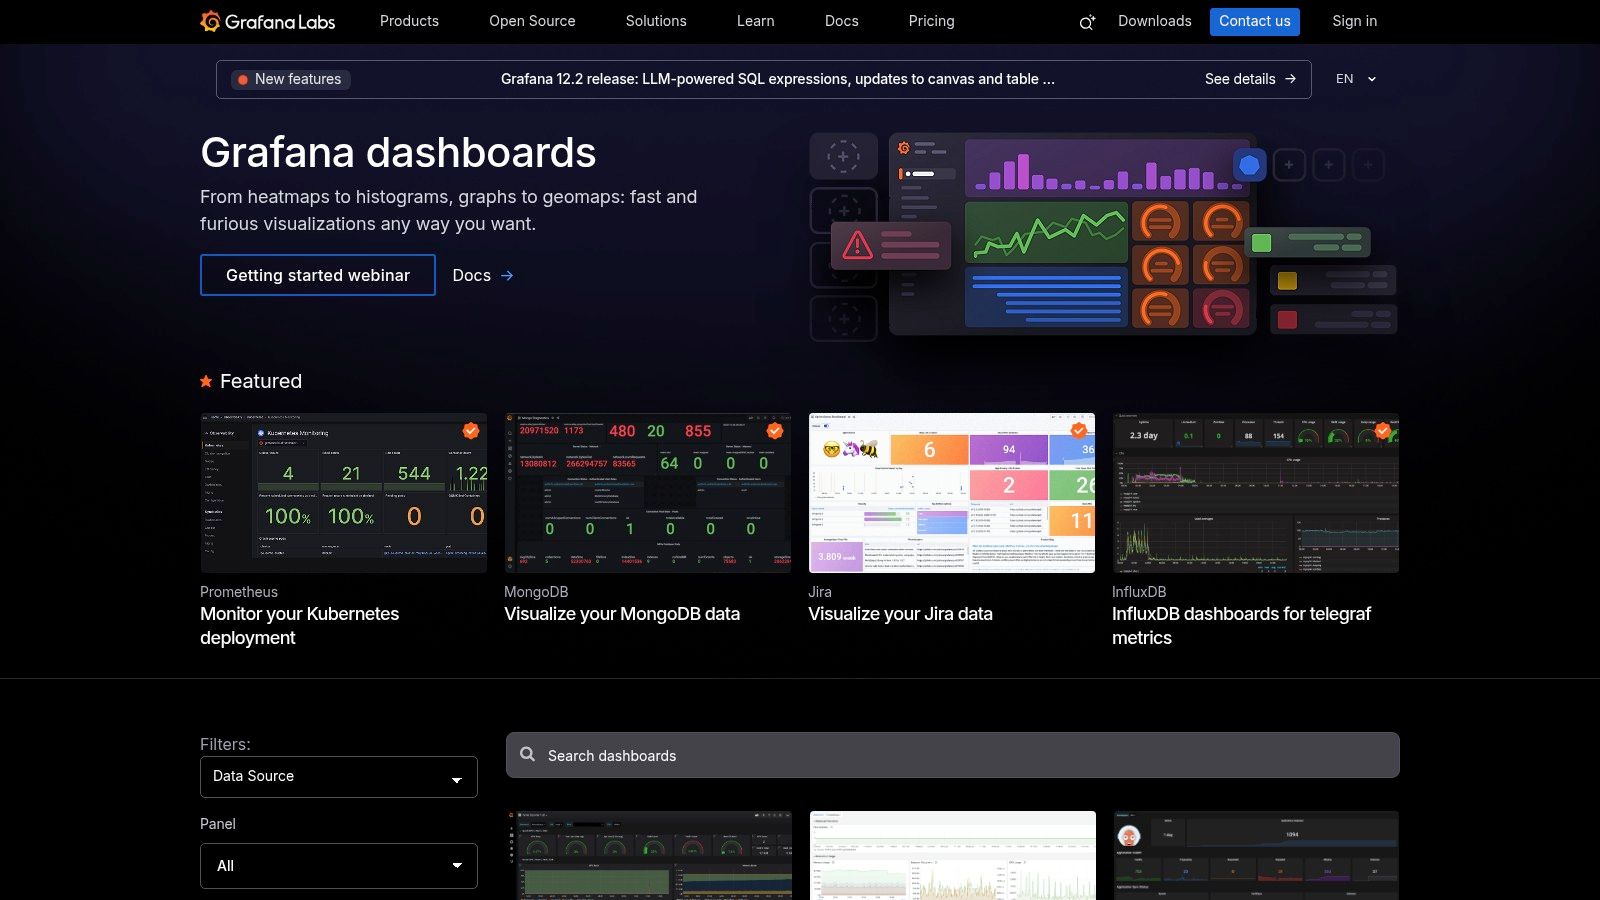
The core value of this library lies in its community-driven, open-source nature. Instead of starting from a blank canvas to monitor a new database or Kubernetes cluster, DevOps and SRE teams can find a battle-tested dashboard in seconds. This radically accelerates the setup of critical monitoring for system health, resource utilization, and application performance, making it an indispensable tool for technical operations.
Strategic Breakdown
Grafana's strategy is centered on empowering the open-source observability community. By providing a centralized, free platform for sharing dashboards, Grafana solidifies its position as the de facto visualization layer for technical monitoring. This approach creates a powerful flywheel effect: as more data sources are created, the community builds and shares dashboards for them, which in turn makes the Grafana ecosystem more valuable and attractive to new users.
Key Insight: The dashboards serve as functional blueprints for specific technologies. They encapsulate the collective knowledge of experts on what metrics are crucial to monitor for a given system, such as a PostgreSQL database or a Redis cache.
Actionable Takeaways
Pros:
- Operational Focus: Unmatched for monitoring servers, databases, containers, and application performance.
- Rapid Deployment: Import dashboards via ID or JSON in seconds, connecting them to existing data sources.
- Vast Community Support: Thousands of dashboards covering a wide array of popular technologies and services.
Cons:
- Technical Niche: Primarily suited for technical and infrastructure monitoring, not for business or sales KPIs.
- Data Source Dependency: Dashboards are often built for specific data exporters and may require configuration to work correctly.
To use this resource effectively, filter by the specific data source and technology you need to monitor. Always check the dashboard's dependencies and reviews to ensure compatibility with your stack. While these dashboards excel at system monitoring, understanding team performance requires a different approach; you can explore other methods for tracking employee productivity and output for a more holistic view.
Website: Grafana Dashboards Library
6. TemplateMonster – Bootstrap Admin & Dashboard Templates
For development teams needing to build a custom performance dashboard with a professional UI, starting from scratch can be a major time-sink. TemplateMonster provides a marketplace where you can purchase pre-built admin and dashboard templates, offering a significant head start on the front-end development. These aren't just static images; they are production-ready codebases (HTML, Bootstrap, React, Vue, etc.) with functional UI components, charts, and responsive layouts.
The primary strength of TemplateMonster is its role as a design and development accelerator. For a fixed, one-time cost, an engineering team can acquire a polished, feature-rich user interface. This allows them to focus their valuable time on the more complex back-end logic, data integration, and defining the specific KPIs, rather than reinventing the wheel on common UI elements like charts, tables, and navigation.
Strategic Breakdown
TemplateMonster's value proposition is centered on a classic "buy versus build" decision. By offering a vast library of templates from various authors, they cater to a wide range of aesthetic preferences and technology stacks. This approach empowers technical teams to bypass the often lengthy and expensive UI/UX design phase, acquiring a visually appealing and functional foundation instantly. These templates serve as a robust scaffold for building powerful, custom performance dashboard examples.
Key Insight: The marketplace model provides choice but requires diligence. While you gain speed and cost-efficiency, the onus is on the buyer to vet the quality of the code and documentation for the specific template they choose.
Actionable Takeaways
Pros:
- Cost-Effective: A small, one-time investment can save hundreds of hours in front-end development.
- Rapid Prototyping & Development: Provides the UI and chart scaffolding needed to get a functional dashboard up and running quickly.
- Technology Variety: Templates are available for popular frameworks like Bootstrap, React, Vue, and Angular.
Cons:
- Requires Technical Implementation: These are front-end templates that require a developer to connect data sources and wire up KPIs.
- Varying Quality: As a marketplace, code quality and documentation can differ significantly between authors.
To get the most value, use the live demos extensively to test responsiveness and user experience before purchasing. Check the template's update history and user reviews to gauge the author's reliability. This ensures you're building on a solid foundation for your custom dashboard project.
Website: TemplateMonster – Bootstrap Admin Templates
7. SlideModel – KPI & Performance Dashboard Templates (PowerPoint/Excel)
Not all performance dashboards need to be complex, interactive business intelligence tools. Sometimes, what you need is a polished, static snapshot for an executive presentation or a board meeting. This is where SlideModel excels, offering a vast library of professionally designed dashboard templates specifically for PowerPoint and Google Slides. Instead of building visuals from scratch, users can download presentation-ready slides and populate them with their data.
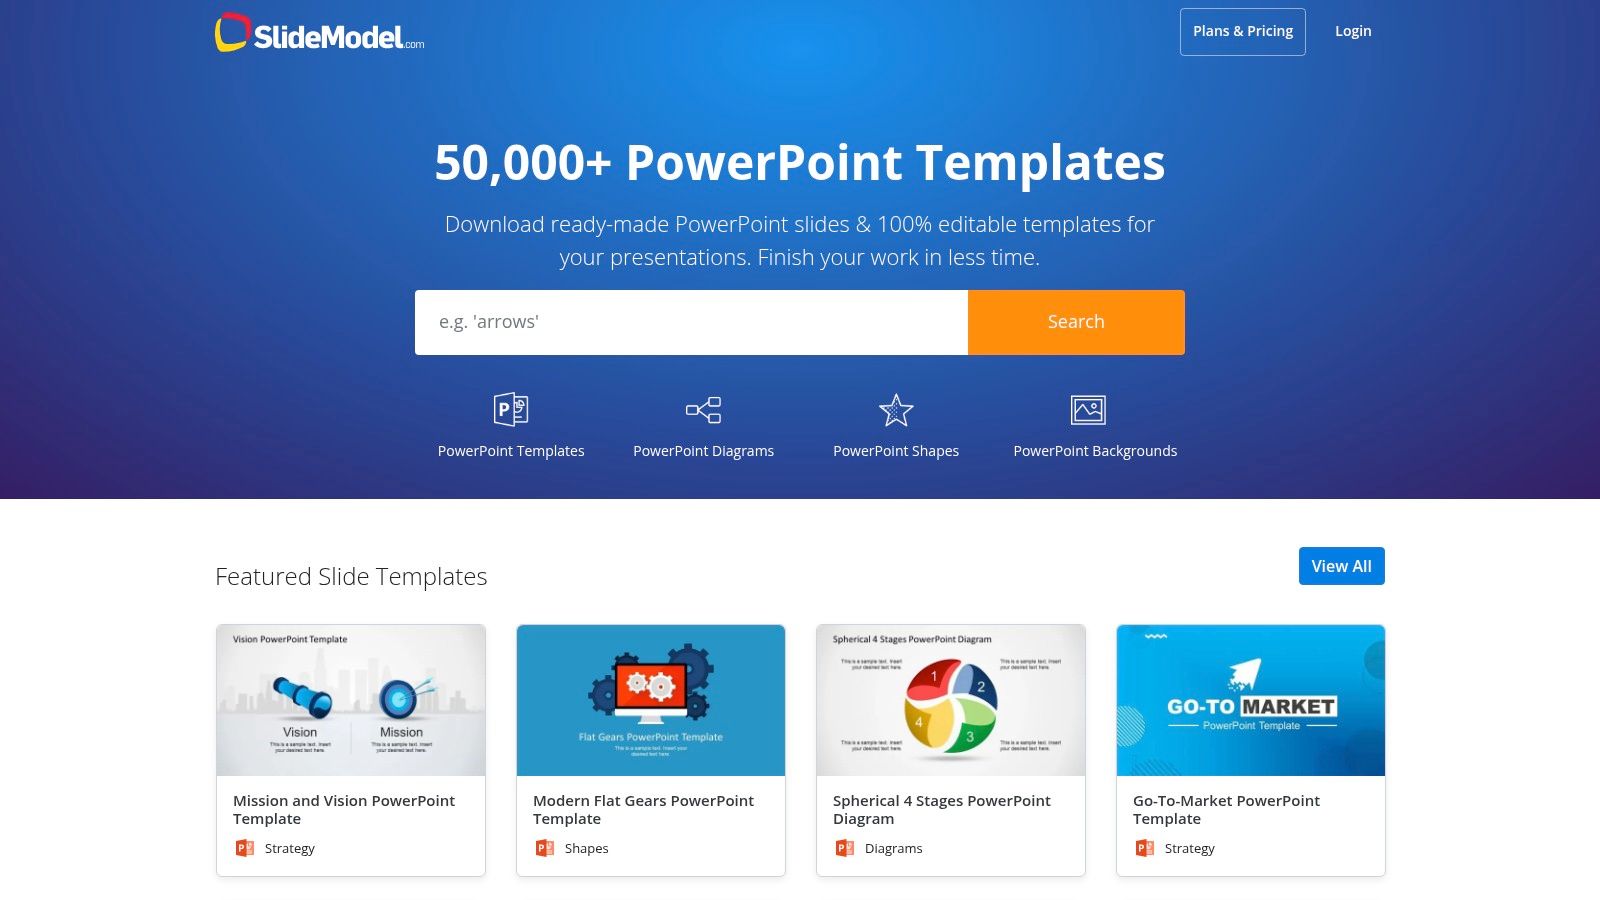
The core strength of SlideModel is its focus on presentation-first design. These are not just charts; they are complete slide layouts crafted for clarity and impact in a reporting context. For managers and consultants who live in PowerPoint, this resource eliminates the cumbersome process of screenshotting BI tools or wrestling with basic chart functions, providing a direct path to a high-quality, professional-looking report.
Strategic Breakdown
SlideModel’s strategy is built on serving the widespread need for effective internal and client-facing communication. They recognize that while interactive dashboards are powerful for analysis, static presentations remain the primary vehicle for delivering key findings and strategic recommendations. By providing 100% editable templates, they bridge the gap between raw data analysis and compelling storytelling.
Key Insight: SlideModel’s value lies in its seamless integration into existing business workflows. It doesn’t try to replace BI tools; it complements them by making the final step of reporting faster, easier, and more visually appealing.
Actionable Takeaways
Pros:
- Speed to Presentation: The fastest way to create board-ready or client-ready KPI dashboards without BI tool setup.
- Offline and Integrated: Works perfectly within familiar PowerPoint and Excel ecosystems, requiring no internet for editing.
- Professional Design: Templates are designed with aesthetic principles, ensuring a polished final product.
Cons:
- Static by Nature: These are not interactive dashboards and require manual data updates unless linked to an Excel source.
- Subscription-Based: Access to the full library requires a subscription, with plans based on download limits.
To maximize this resource, use it for summarizing performance narratives for leadership. For recurring reports, link the charts in your PowerPoint slide directly to an Excel spreadsheet. This allows you to update the data in one place and have it automatically refresh in your presentation, combining the ease of Excel with SlideModel's design quality. This approach is highly effective for teams looking for better ways to understand how to measure team productivity and report on it consistently.
Website: SlideModel
7 Performance Dashboard Examples Compared
| Solution | Implementation 🔄 | Resources ⚡ | Expected outcomes 📊⭐ | Ideal use cases 💡 | Key advantages ⭐ |
|---|---|---|---|---|---|
| TimeTackle | Moderate — connect calendars, configure automations | Low–Moderate — Google/Outlook, Chrome extension, admin setup | High — automated time capture, better utilization, billing accuracy | Agencies, client-facing teams, execs, product/engineering | Calendar-first auto-capture, AI tagging, robust exports & security |
| Tableau Exchange – Accelerators | Low–Moderate — download + map data to templates | Moderate — requires Tableau license and some authoring skill | High — ready executive/KPI views with Tableau best practices | BI teams needing fast enterprise dashboards | Vetted, industry-specific accelerators; speeds time-to-value |
| Power BI – Data Stories Gallery | Low — browse examples; download depends on author | Low — Power BI access for editing; community support | Medium — inspiration and reusable patterns; variable quality | Designers/analysts seeking real-world report patterns | Large community samples; author interactions and PBIX sometimes available |
| Google Looker Studio – Template Gallery | Very low — one-click copy & connect | Low — Google account; best with Google data sources | High (for web/marketing) — quick GA4/Ads/YouTube dashboards | Marketing, web analytics teams using Google ecosystem | One-click templates, fast setup, free with Google account |
| Grafana Dashboards Library | Low–Moderate — import JSON/ID and adapt panels | Moderate — requires Grafana and data sources (Prometheus, Loki, etc.) | High (operational) — immediate observability & infra metrics | SREs, DevOps, infra/app performance monitoring | Large library for infra stacks; easy import into Grafana instances |
| TemplateMonster – Admin & Dashboard Templates | Moderate — front-end UI requires wiring to data | Moderate — purchase templates + dev effort to integrate | Medium — polished UI scaffolding; analytics must be built | Engineering teams wanting polished dashboard UIs quickly | Wide template selection, live demos, transparent pricing |
| SlideModel – KPI & Performance Templates | Very low — download slides and customize | Low — PowerPoint/Excel skills; subscription access | Medium — presentation-ready static KPIs for execs | Board reports, client presentations, offline reporting | Professionally designed slides; fastest path to presentable KPIs |
Putting These Insights Into Practice
The most effective performance dashboard is the one that gets used. As we've seen from these diverse performance dashboard examples, effectiveness isn't about cramming every possible metric onto a single screen. It stems from a clear purpose, a defined audience, and a relentless focus on simplifying complex information into actionable insights.
From the community-driven templates in Tableau and Power BI to the highly specialized operational views in Grafana, a common thread emerges. The best dashboards answer critical business questions at a glance. They transform raw data into a compelling narrative that guides decision-making, rather than creating more noise.
Synthesizing the Key Takeaways
The journey through these examples reveals several core principles for building impactful dashboards. Whether you're a COO seeking utilization visibility or a project manager battling manual reporting, these fundamentals are universal.
- Start with the "Why": Before choosing a single chart or metric, define the primary questions your dashboard must answer. An executive dashboard needs high-level KPIs, while an engineering team's dashboard requires granular, real-time data.
- Audience-Centric Design: Tailor the complexity and data granularity to your audience. A CFO needs to see financial impact and utilization rates, while a team lead might need to see individual task progress and workload distribution.
- Context is Everything: A metric without context is just a number. Use trends, targets, and comparative data to tell the full story. As seen in the SlideModel and TemplateMonster examples, even static presentations benefit immensely from showing performance against a goal.
Your Next Steps: From Inspiration to Implementation
Feeling inspired by these performance dashboard examples is the first step. The next is turning that inspiration into a practical tool for your organization. Here’s a simple framework to get you started.
- Define Your Core Objective: Pinpoint the single most important problem you need to solve. Is it improving project profitability, increasing team utilization, or reducing reporting overhead? Be specific.
- Identify Your Key Metrics: Based on your objective, list the 3-5 metrics that matter most. For professional services, this often includes utilization rates, billable vs. non-billable hours, and project budget variance.
- Choose the Right Tool for the Job: Your tool should align with your objective and existing tech stack. If you need deep, custom BI, Tableau or Power BI are powerful choices. If your primary pain point is understanding how your team's time is actually spent without manual timesheets, a specialized tool is far more efficient.
For teams struggling with the operational blind spots caused by timesheet fatigue and manual data entry, the path to a meaningful performance dashboard can feel blocked. Tools like TimeTackle provide a powerful, automated solution. By analyzing calendar data, they surface a true picture of team activity and resource allocation, revealing the "why" behind your performance metrics. This allows you to build dashboards that don't just track what happened, but actively help your team make smarter, data-driven decisions about where to focus their efforts.
Ready to move beyond manual tracking and build performance dashboards based on reality? TimeTackle automates resource and activity tracking by analyzing your team's calendar data, giving you the accurate insights needed to drive efficiency and profitability. Discover how to transform your team's time into your most valuable asset by visiting TimeTackle.