In a world overflowing with specialized time tracking apps, sticking with an Excel spreadsheet might feel a bit old-school. But for many modern agencies, a well-designed template excel timesheet isn't a compromise—it's a strategic move.
Why A Custom Excel Timesheet Still Makes Sense For Agencies
Let's be honest, the biggest reason agencies still lean on Excel is flexibility. It’s unparalleled. Unlike rigid software that forces you into its box, a spreadsheet can be molded to fit your agency’s unique project structures and sometimes-funky client billing requirements.
For instance, a creative agency might need to track non-standard metrics like "concepting hours" versus "production hours." That's a specific distinction many apps just can't handle without clunky workarounds. A custom template lets you build those exact categories right into your workflow from day one.
The Power of Familiarity and Cost Control
Another huge plus? The almost non-existent learning curve. With Microsoft Office 365 holding nearly 30% of the global market share for office productivity suites as of February 2024, your team already knows their way around a spreadsheet. This familiarity gets rid of the need for tedious training and onboarding that comes with new software, meaning everyone can jump right in.
The real value of a custom Excel timesheet lies in its ability to adapt to your agency's specific billing and reporting needs without forcing you into a one-size-fits-all software solution. It puts you in complete control of your data and processes.
Of course, this approach isn't perfect. The most common pitfall is the risk of manual entry errors, which can throw off your data's integrity. But as we'll show you in this guide, you can build a much smarter, more reliable system using Excel's own built-in features.
For a more balanced perspective, it helps to understand the pros and cons of timesheets in Excel or Google Docs.
Excel Timesheets vs Dedicated Software A Quick Comparison
Deciding between a custom-built Excel solution and a dedicated software subscription often comes down to a trade-off between control and convenience. Here’s a quick rundown to help you see which path might be better for your agency.
| Feature | Excel Timesheet Template | Dedicated Time Tracking Software |
|---|---|---|
| Cost | No additional cost (part of existing Microsoft 365 subscription). | Monthly/annual subscription fees per user, which can add up quickly. |
| Customization | Highly flexible. You can add any custom fields, formulas, or reports your agency needs. | Limited to the features and customization options provided by the vendor. |
| Learning Curve | Minimal. Most team members are already familiar with Excel. | Requires team training and onboarding for a new interface and workflow. |
| Integration | Manual data export/import required to connect with other systems like accounting software. | Often offers seamless integrations with project management, payroll, and invoicing tools. |
| Automation | Limited to Excel's built-in formulas and macros, which require setup. | Features like automatic timers, reminders, and automated reporting are standard. |
| Error Potential | Higher risk of manual entry errors, formula mistakes, and version control issues. | Lower risk due to built-in validation, locked fields, and centralized data management. |
| Real-Time Reporting | Reports are generated manually (e.g., refreshing a PivotTable). | Live dashboards and real-time reporting provide instant insights without manual effort. |
Ultimately, the best choice depends on your team's size, technical skill, and specific reporting needs. An Excel template offers incredible power for free, but dedicated software provides automation and reduces the administrative burden.
Balancing Customization With Market Alternatives
While building your own template gives you tailored control, it's always smart to see what else is out there. Exploring various free time tracking software options can help you weigh the benefits of a custom build against the convenience of off-the-shelf tools. This ensures you're making the best decision for your agency's specific needs and scale.
Designing a Rock-Solid Timesheet Structure
Before you even think about formulas or fancy dashboards, you have to get the foundation right. The entire usability of your template excel timesheet—and the quality of data you get from it—hinges on its structure. A bad layout is more than just an inconvenience; it leads to confusing entries, inaccurate data, and a massive headache when it's time to run reports.
Think of it like building a house. You wouldn't just start throwing up walls without a blueprint, right? For our timesheet, that blueprint is a carefully planned set of columns. Each one needs to serve a specific purpose, feeding the data you need for both accurate payroll and bulletproof client billing.
This isn't just about logging hours. A well-designed timesheet is a strategic tool. It needs to be flexible for your team, cost-effective for the business, and capable of giving you the financial insights you need to make smart decisions.
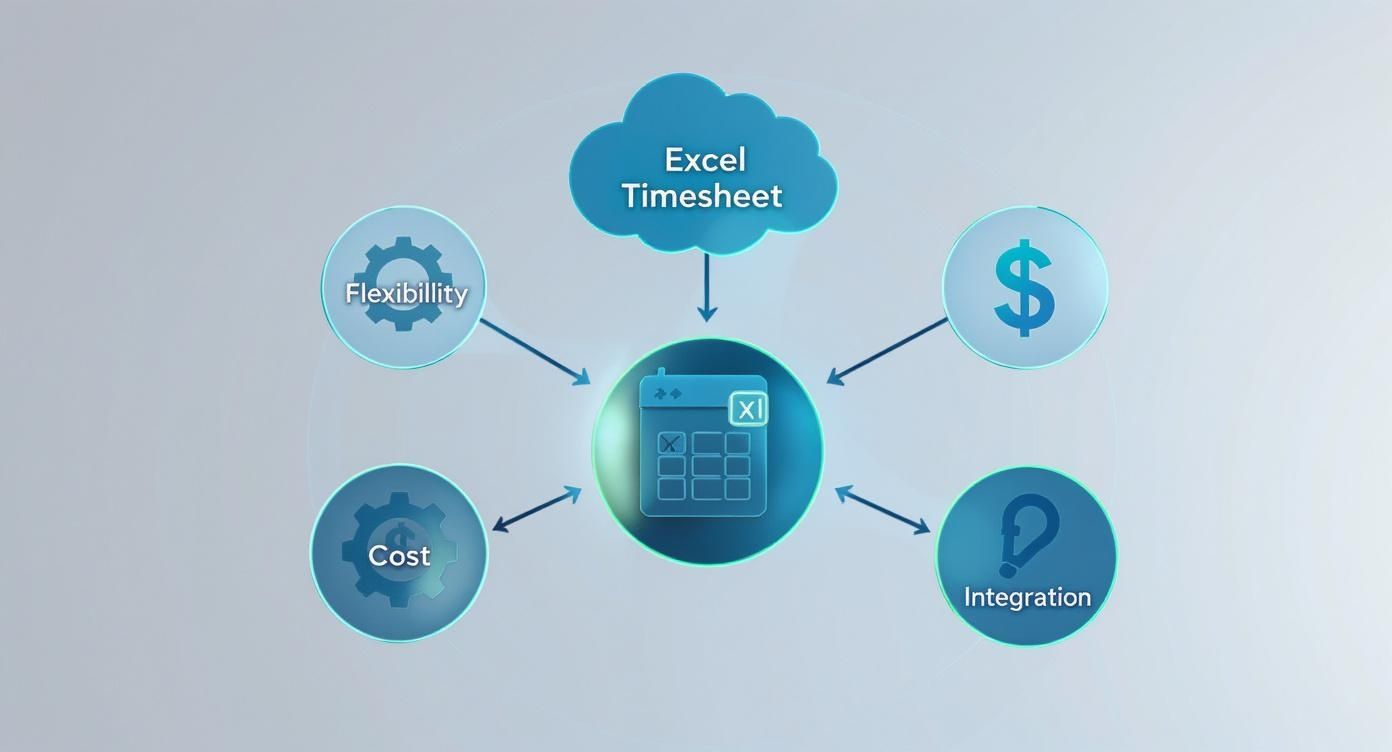
As you can see, a thoughtful design is all about balancing adaptability with tight financial control. Get that balance right, and you've got a powerful asset on your hands.
Core Columns for Agency Success
For any agency, a useful timesheet needs to do more than just track a date and a number of hours. Every single column should capture a piece of data that answers a critical business question: Who did what, for whom, and for how long?
Here’s my go-to list of essential columns that every agency timesheet should have:
- Date: The day the work actually happened. This is non-negotiable for any kind of weekly, bi-weekly, or monthly reporting.
- Employee Name: Absolutely critical for teams. It lets you filter data for individuals and run payroll without any guesswork.
- Client Name: Your top-level identifier. This is key for high-level reporting on things like client profitability and resource allocation.
- Project Code: This is where you get granular. A unique code for each project (e.g., 'CL101-WEB') helps you track budgets and scope for specific deliverables.
- Task Description: A short, clear note on the activity. It adds context that a project code can't, like "Wireframing homepage" or "Client feedback call."
- Start Time: The time a task kicked off (e.g., 9:05 AM).
- End Time: The time the task wrapped up (e.g., 11:30 AM).
- Break (in minutes): I highly recommend this, even if it’s optional. It lets you accurately subtract unpaid breaks, which keeps payroll fair and transparent.
This structure gives you the detail you need for precise client invoicing and smart internal planning. It's the difference between just logging hours and creating a detailed, defensible record of your agency's work.
A Practical Agency Example
Let's put this into practice. Imagine a designer at a digital marketing agency logging their morning activities. Their timesheet would look clean and simple, but packed with valuable data:
| Date | Employee Name | Client Name | Project Code | Task Description | Start Time | End Time |
|---|---|---|---|---|---|---|
| 2024-10-28 | Sarah Jones | GreenScape Co. | GS-SEO-Q4 | Keyword research for blog | 9:00 AM | 11:15 AM |
| 2024-10-28 | Sarah Jones | AutoPro Sales | AP-PPC-24 | Adjusting Google Ads campaign | 11:15 AM | 12:00 PM |
The real power of a well-defined structure is clarity. It eliminates ambiguity, ensuring that every minute logged can be confidently tied to a specific client, project, and billable activity. This clarity is the bedrock of accurate financial reporting.
Nailing these columns from the start makes your timesheet easy for your team to use and powerful enough to generate the detailed reports that managers and clients demand. This foundational work makes everything else—from automated formulas to insightful Pivot Tables—so much easier and more effective down the line.
Bringing Your Timesheet to Life with Excel Formulas
A well-designed template is a great start, but it's the formulas that turn a static grid into a smart, time-saving tool. This is where your template excel timesheet really starts working for you, preventing costly mistakes and taking the manual grunt work out of payroll.
The whole idea is to build a system where your team just has to plug in the raw data—their start and end times, and what project they worked on. Excel should do the rest, from totaling up hours to flagging overtime. This kind of automation is exactly why so many HR and payroll teams swear by Excel; it makes confirming attendance and processing pay a whole lot smoother. As the folks at TrackingTime.co point out, it's all about reducing those manual calculation errors.
Calculating Total Hours Worked
The first and most important formula you'll need is the one that calculates the time between clock-in and clock-out. It sounds easy, but there's a classic snag: shifts that go past midnight.
Let's say your Start Time is in cell F2 and the End Time is in G2. A simple formula like =(G2-F2)*24 works perfectly for a standard 9-to-5 shift. But what about a designer who starts at 10 PM and finishes at 2 AM the next day? That same formula will spit out a negative number, which is obviously no help.
To build a more reliable formula that can handle overnight shifts without a problem, you'll want to use this instead:
=MOD(G2-F2,1)*24
The MOD function is the key here. It neatly sidesteps the overnight issue by calculating the remainder when the time difference is divided by 1 (which Excel sees as a full 24-hour day). This ensures you always get a positive, correct number. Multiplying the result by 24 is the final step, converting Excel’s funky decimal time format into the hours you actually need for payroll.
Setting Up Overtime Calculations
Once you have the total hours nailed down, the next step is to automatically separate regular hours from overtime. This is a must-have for accurate pay and for keeping an eye on team workload. The logic will depend on your company’s policy, but a common rule is that anything over 8 hours a day or 40 hours a week is overtime.
Let's assume the total daily hours are sitting in cell I2. You can use a clever combination of the MIN and IF functions to split the hours automatically.
-
For Regular Hours:
=MIN(8, I2)
This formula looks at the total hours in I2 and gives you the smaller of two numbers: the total hours or 8. If someone works 10.5 hours, this cell will simply show 8. If they only work 6 hours, it will correctly show 6. -
For Overtime Hours:
=IF(I2>8, I2-8, 0)
This one checks if the total hours in I2 are greater than 8. If they are, it subtracts 8 to figure out the overtime amount. If not, it just returns 0.
These two little formulas work in tandem to perfectly divide the workday into the right pay buckets, with zero manual input needed. For more complex setups, like calculating weekly overtime, you might want to check out our deep-dive guide on essential Excel timesheet formulas.
Distinguishing Billable vs. Non-Billable Hours
For any agency or professional service firm, knowing how much time is spent on actual client work versus internal tasks is everything. This is another job for a simple IF statement, paired with a column dedicated to tracking billable status.
A key to agency profitability is maximizing billable hours. Automating this calculation in your timesheet provides real-time visibility into how team members are contributing to revenue-generating activities.
First, you'll want to add a new column, maybe titled "Billable?", where your team can choose "Yes" or "No" from a dropdown menu (we'll get to how to create those in a bit). If we assume this is column K and your total hours are still in column I, you can use these formulas to sort the time entries.
- Billable Hours:
=IF(K2="Yes", I2, 0) - Non-Billable Hours:
=IF(K2="No", I2, 0)
With this in place, every single time entry is automatically categorized. This makes it incredibly easy to run reports later to check on project profitability or see how your team's utilization is tracking.
Boosting Accuracy with Data Validation and Dropdowns
Even with the smartest formulas, your template excel timesheet is only as good as the data going into it. Manual entry is the single biggest threat to its integrity.
Typos, inconsistent naming, and simple human error can quickly turn your clean, automated system into a reporting nightmare. This is where Excel's Data Validation feature becomes your most powerful ally.
The challenge is bigger than you might think. Some reports suggest that a staggering 88% of spreadsheets contain errors rooted in manual input. These aren't just minor mistakes; they can seriously mess with your payroll and client billing. Learn more about the impact of spreadsheet errors. Building in safeguards isn't just a "nice-to-have"—it’s essential for creating a tool you can actually trust.

The simplest yet most effective use of Data Validation is creating dropdown menus. By restricting input to a predefined list, you completely eliminate errors for fields like Client Name, Project Code, or Task Category. No more dealing with "Client A" in one row and "Client A Inc." in another.
Creating Scalable Dropdown Lists
To pull this off, you’ll want to manage your lists centrally. A common mistake I see is people hardcoding the list directly into the validation rule, which is a real pain to update. A much smarter approach is to create a separate tab in your workbook—let's call it 'Lists'.
On this 'Lists' sheet, you can create columns for each dropdown you need:
- Column A: Client Names
- Column B: Project Codes
- Column C: Task Types (e.g., Billable, Non-Billable)
Once your lists are set up, head back to your main timesheet tab. Select the column where you want the dropdown to appear (like the 'Client Name' column). Navigate to the Data tab on the ribbon and click Data Validation.
The goal of data validation isn't just to prevent errors; it's to make the timesheet faster and easier for your team to use. A well-placed dropdown menu reduces cognitive load and removes guesswork.
In the dialog box that pops up, under 'Allow', choose List. For the 'Source', click the small arrow icon and navigate to your 'Lists' tab, selecting the entire range of client names. This dynamic link means that whenever you add a new client to your list, it automatically appears in the dropdown. No manual updates needed.
Preventing Illogical Time Entries
Data Validation can also enforce basic logic. A classic timesheet error is an end time that happens before the start time. You can create a custom validation rule to block this from ever happening.
Select your 'End Time' column, open Data Validation, and choose 'Custom' from the 'Allow' dropdown. If your first 'Start Time' entry is in cell F2, you would enter this formula:
=G2>=F2
This simple rule tells Excel that the value in the 'End Time' cell (G2) must be greater than or equal to the corresponding 'Start Time' (F2), effectively making impossible time entries a thing of the past.
Turning Timesheet Data into Actionable Insights
A completed timesheet is way more than just a record of hours worked. It's a goldmine of business intelligence just sitting there, waiting to be tapped. The real power of your template excel timesheet is unleashed when you can turn that raw data into clear, actionable insights for things like resource planning and profitability analysis. This is the leap from simple tracking to strategic decision-making.
But let’s be honest, many managers struggle to get meaningful information out of the sheer volume of data collected. The raw format of a timesheet isn't built for a quick glance, and that can lead to missing crucial trends or drawing the wrong conclusions about productivity.
The key to fixing this is buried right inside Excel: the PivotTable.

Building Your First PivotTable Report
A PivotTable is a powerful feature that lets you summarize and rearrange columns and rows of data from your timesheet without touching the original entries. Think of it as an interactive summary table you can twist and turn on the fly.
To get one started, first make sure your data is formatted as an Excel Table. Just select your data range and press Ctrl+T. This little trick makes your data source dynamic, meaning the PivotTable will automatically grab any new entries you add later. Game changer.
Now, with your cursor anywhere inside that table, head over to the Insert tab and click PivotTable. Excel is usually smart enough to auto-select your table range, so just hit OK.
You'll see the PivotTable Fields pane pop up on the side. This is your command center for building the report. You just drag and drop fields into four distinct areas:
- Rows: This organizes your data vertically. Dragging the
Client Namefield here is a great starting point. - Columns: This slices the data horizontally. You could use
Employee Nameto see a breakdown by team member across the top. - Values: This is for the numbers you want to crunch. Drag your
Billable HoursandNon-Billable Hoursfields here. - Filters: This lets you narrow down the entire report by a specific item, like a
Project Code.
With just those few clicks, you can instantly see the total billable hours logged for each client, broken down by the employee who did the work.
The real magic of a PivotTable is its ability to answer complex business questions in seconds. You can pivot from asking "How many hours did we work?" to "Which client is eating up the most non-billable time, and why?"
Making Your Reports Interactive with Slicers
If PivotTables are the engine, Slicers are the dashboard. They are basically user-friendly filter buttons that make your reports truly interactive. Instead of fumbling with filter dropdowns, managers can just click a button to instantly view data for a specific person, date range, or project.
To add a slicer, click anywhere on your PivotTable, which brings up the PivotTable Analyze tab on the ribbon. From there, select Insert Slicer. A box will pop up, letting you choose which fields you want to create slicers for. For a timesheet report, the most useful ones are typically:
- Employee Name
- Client Name
- Date (or Month)
Once your slicers are on the sheet, clicking a name or a client will instantly filter your PivotTable to show only that data. This transforms a static report into a dynamic dashboard that's perfect for team meetings or performance reviews.
You can even explore a variety of performance dashboard examples to get inspired about what other metrics you might want to track. By combining PivotTables and Slicers, your Excel timesheet becomes an invaluable asset for really understanding project profitability and team efficiency.
Your Top Excel Timesheet Questions Answered
Once you start building your own timesheet template, you'll inevitably run into some real-world challenges. Moving beyond a basic grid of hours often means figuring out how to handle specific agency needs. Let's walk through some of the most common questions that pop up.
These aren't just hypotheticals; they're the practical hurdles that can turn a good template into a great one, helping you manage everything from project finances to distributed teams.
How Can I Track Project Budgets in the Same Timesheet?
This is a smart move and a fantastic way to get a real-time financial snapshot without leaving Excel. The cleanest method is to dedicate a separate tab in your workbook, maybe called 'Projects' or 'Budgets'.
On that new sheet, list out each project name or code. Next to each one, add columns for the total project budget and the specific billable rate for that work.
Then, back in your main timesheet entry tab, you can use a formula like VLOOKUP or the more robust INDEX/MATCH combo. This will automatically pull the correct billable rate whenever a team member selects a project. From there, it's a simple multiplication: billable hours times the pulled rate gives you the cost for that entry. To see the big picture, a Pivot Table can summarize the total billed amounts against the initial budget for each project, giving you a crystal-clear financial overview at a glance.
What Is the Best Way to Handle Timesheets for Remote Teams?
When your team is spread across different time zones, consistency is everything. The most effective way to avoid chaos is to establish a single, official company time zone for all entries—whether that’s UTC, EST, or whatever your headquarters uses.
Mandating a single time zone for all entries is the simplest way to eliminate confusion and ensure fairness in payroll and reporting for a distributed team. It creates one source of truth for all time-based calculations.
You can still add an optional column where employees can note their local time for their own reference, but make it clear that all official calculations for payroll and reports must be based on the standardized time. This approach makes consolidating reports a breeze and guarantees that hour tracking is consistent and fair for everyone, no matter where they're logging in from.
Can I Protect My Excel Template from Accidental Edits?
Absolutely—and you really should. Protecting your template is critical to prevent someone from accidentally deleting a complex formula or messing up the layout you worked so hard on. The trick is to lock down the structure while leaving the data entry cells open for business.
It’s a pretty straightforward process:
- First, select all the cells where your team needs to type—things like Start Time, End Time, and Task Description.
- With those cells highlighted, right-click, choose 'Format Cells,' and head to the 'Protection' tab. Uncheck the 'Locked' box and click OK.
- Finally, go to the 'Review' tab on the main Excel ribbon and click 'Protect Sheet'. You can add a password if you want, but it's optional.
Just like that, you’ve locked every cell except the ones you specifically unlocked. Your formulas and formatting are now safe from stray clicks, but your team can still fill out their timesheets without a problem.
If you're tired of chasing timesheets and manually building reports, TimeTackle can automate the entire process for you. By connecting directly to your team's calendar data, it eliminates manual entry and provides instant, accurate insights into project profitability and team utilization. Explore how TimeTackle can save you hours of administrative work.