Let's be honest—'efficiency' and 'productivity' get tossed around so often they start to feel like empty corporate jargon.
For a modern agency, though, getting these ideas right isn't just about sounding smart in a meeting. It’s about survival and profitable growth. It’s the difference between just being busy and doing more of the right work with the resources you have, all without burning out your team.
What efficiency and productivity really mean now

When we talk about efficiency and productivity in professional services, we're not just counting completed tasks. It’s time to move past those vague definitions and focus on what actually moves the needle for your business.
This means finding real answers to some tough questions:
- Are our projects actually profitable once you factor in all the time spent on them?
- Can we increase our billable utilization without pushing our team to the breaking point?
- Are we making resource decisions based on hard data, or are we just guessing who seems least busy?
- Is our scoping process accurate, or are we consistently going over budget?
For too long, agencies have leaned on manual timesheets to get these answers. The problem? They just don't work. Manual tracking is a pain for your team, it's filled with errors, and it almost always gives you bad data. You can't fix what you can't measure accurately.
The evolution of productivity
The push for better productivity isn't new. We’ve seen it evolve from the factory floor to the modern digital agency. History shows us moments where fresh approaches unlocked massive gains.
For instance, U.S. labor productivity grew at a solid 2.7 percent annually from 1950 to 1970. We saw another spike between 1994 and 2004, hitting 2.9 percent thanks to the internet boom. More recently, 2023 saw another surge of 2.7 percent, nearly matching those historic highs. These compounding gains have pushed output per hour from an index of 100 in 1960 all the way to 366 by mid-2024. You can dig into these long-term trends over at the Economic Strategy Group.
These historical shifts show a clear pattern: big leaps in productivity happen when we fundamentally change how we measure and manage work. The assembly line optimized physical tasks, and the internet optimized information. For today's agencies, the next leap comes from truly understanding where your most valuable asset—your team's time—is actually going.
Why old methods fall short
The biggest issue with old-school methods is the disconnect between the creative work being done and the data you're collecting. A design team's output can't be measured like widgets on a conveyor belt. Their real value is in solving complex problems, not just clocking hours.
The truth is, when your team sees time tracking as a chore they have to complete just to get paid, the data you get back is almost useless for making strategic decisions. It becomes a box-ticking exercise, not a source of business intelligence.
This creates a cycle of bad data and reactive decisions. You might think a project is profitable, but without knowing the true time sunk into endless revisions, internal meetings, and admin tasks, you're just flying blind.
This guide isn't about theory. It’s a practical playbook for building a more sustainable and profitable agency, based on reality. And it all starts with a commitment to measuring what matters.
Choosing the right metrics to track
Before you can fix anything, you need a scoreboard that tells the truth. The big mistake I see agencies make is getting bogged down tracking vanity metrics—numbers that look great in a report but don't actually help you make smarter decisions.
If you’re serious about boosting team efficiency, you have to zero in on the handful of metrics that connect directly to your agency's financial health and operational reality.
I find it helps to split these into two buckets: one focused on your team's time and the other on your project's performance.
Utilization metrics
First things first, you have to understand how your team's time is actually being spent. Utilization metrics are the bedrock of good resource planning and smart hiring decisions. They also help protect your people from burnout. You simply can't improve efficiency if you don't know where the hours are going.
Here are the non-negotiables:
- Billable Utilization Rate: What percentage of a team member's time is spent on billable client work? For any agency, this is the single most important number for profitability.
- Team Capacity: This is the total number of work hours your team has available. Calculating this shows you if you're over or under-resourced and whether you can take on that new project without breaking your current team.
- Non-Billable Time: This tracks all the time spent on necessary things like internal meetings, admin tasks, training, and new business pitches. It’s all essential work, but high non-billable hours can point to hidden inefficiencies eating away at your margins.
For a healthy mid-sized agency, you should be aiming for a billable utilization of around 75-85%. If you’re pushing much higher than that, you're risking burnout. If you're consistently below 70%, you either have too many people on the bench or you’re drowning in internal work.
I once worked with an Ops Lead who ran her team on gut feelings. After we started tracking utilization, she was shocked to find her design team's billable rate was only 55%. The data clearly showed they were losing nearly 15 hours a week to non-essential internal review meetings. Armed with that data, she finally had the mandate to fix a problem she had only suspected before.
Project performance metrics
While utilization tells you how your team is spending their time, project performance metrics tell you if that time is being spent profitably. This is where you connect your team's daily work directly to business outcomes.
These numbers should be front and center on every project manager's dashboard:
- Project Profitability: The ultimate measure of success. This is simply a project’s revenue minus all its costs, including the cost of every single hour spent on it (both billable and non-billable).
- Budget Variance: How does your estimated project budget stack up against the actual cost? If you're consistently seeing a negative variance, your scoping or estimation process is broken.
- Write-offs: This tracks any time worked that you can't bill the client for, usually because of scope creep or going over budget. It’s a direct, painful hit to your bottom line.
A good rule of thumb is to keep budget variance within 5-10% of your initial estimate. If you find your teams are writing off more than 10% of their time on projects, it's a huge red flag that your scoping process needs a serious overhaul.
Essential productivity metrics for agencies
To make this crystal clear, here’s a table breaking down the core metrics every agency should be tracking. These aren't just numbers; they are the signs of your business's health.
| Metric | What It Measures | How to Calculate It | Why It Matters |
|---|---|---|---|
| Billable Utilization Rate | The percentage of an employee's time spent on revenue-generating work. | (Total Billable Hours / Total Available Hours) x 100 | Directly connects to profitability and efficient resource allocation. |
| Project Profitability | The net profit or loss of an individual project. | Project Revenue – (Total Hours Worked x Blended Cost Rate) – Other Direct Costs | The ultimate indicator of whether a project was financially successful. |
| Budget Variance | The difference between the estimated budget and the actual project cost. | (Actual Cost – Budgeted Cost) / Budgeted Cost x 100 | Reveals the accuracy of your scoping, estimation, and project management. |
| Non-Billable Time | Time spent on internal tasks that don't generate direct revenue. | Total Hours – Billable Hours | Identifies operational drag and opportunities to improve internal processes. |
Tracking these metrics gives you a complete picture, showing you not just how busy your team is, but how effective that busyness is.
By separating your metrics into these two buckets, you can finally move from guesswork to a clear, actionable framework. You can start answering critical questions with confidence and, when needed, prove the impact of your client outreach by using an email tester and spam checker to ensure your communications are effective.
For a more comprehensive look at this, you can check out our guide on how to measure team productivity.
Alright, let's get practical. It's time to have an honest conversation about timesheets.
We’ve all been there. Chasing down team members on a Friday afternoon, begging them to fill out timesheets they barely remember. The data you get is questionable at best, and the whole process creates friction. There’s a much better way. The key to unlocking real efficiency and productivity data isn’t more nagging—it’s automation.
The good news? For most professional services teams, the foundation is already in place. Your team’s calendar is the real source of truth for how their days are spent. It’s where meetings live, focus time is blocked, and project work is scheduled. By tapping into this existing system, data capture becomes a quiet, background process instead of another tedious chore.
This is the secret: getting truly accurate data without driving your team crazy.
Connect your calendars and core tools
First things first, you need to hook your team's work calendars—whether it's Google Calendar or Outlook—into a central time intelligence platform. This simple connection automatically pulls in every single event, meeting, and time block. No one has to lift a finger.
But just grabbing calendar events is only half the story. The real magic happens when you connect that system to the other tools your team lives in every day.
- Link your CRM: This automatically ties calendar events to the right client, account, or sales opportunity.
- Link your project management tool: This connects time spent directly to specific projects, phases, and tasks.
Suddenly, when an account manager has a call with "Acme Corp," the system instantly knows it's for that client because the data is synced from your CRM. This completely eliminates the manual tagging and guesswork that slow people down and lead to errors.
Build a simple, powerful tagging system
Even with great integrations, you'll still want a way to add extra context. This is where a smart tagging system comes into play. The aim here is to create a structure that's simple for your team but gives you incredibly powerful, sliceable data for your dashboards.
Resist the urge to overcomplicate it. I've seen agencies create dozens of confusing tags, and it never works. A few well-designed, high-level tags are infinitely more effective.
Here’s what I’ve found works best:
- Keep it clean: Start with essential categories like Billable, Non-Billable, Internal, and Admin.
- Use project codes: If you aren’t already, start using consistent project codes that can be easily dropped into calendar event titles.
- Create automation rules: This is a game-changer. Set up rules so that events with certain keywords (e.g., "Daily Standup") are automatically tagged as Internal, further reducing any manual effort.
The ultimate goal of your tagging system should be zero-effort reporting. If your team has to pause and puzzle over which of 20 tags to apply to a 15-minute call, you've already lost the battle for accurate data.
![]()
This entire flow—from data collection to analysis—hinges on making the initial capture as seamless as possible. Raw data is the input, but it only becomes valuable once it's processed through utilization and performance metrics.
Make data capture an invisible process
The end goal is to make all of this completely invisible. Your team should just go about their day, using their calendars exactly as they always have. The data capture happens silently, automatically, in the background.
This is a huge mental shift away from the old "stop work and fill out your timesheet" model. By meeting your team where they already work—their calendar—you remove the single biggest obstacle to accurate time tracking: the human effort involved.
When data capture becomes a passive, automated habit, two incredible things happen:
- Your data becomes far more accurate. You're no longer relying on someone's frazzled memory at 5:00 PM on a Friday.
- Team adoption hits nearly 100% because you aren't actually asking them to do anything extra. It just works.
This automation-first mindset can ripple out to other areas of your business, too. For instance, once you see the power of automated time data, looking into accounting automation to handle invoicing and expenses becomes a natural next step.
You can also find more ways to automate other repetitive tasks to give your team even more time back. By setting up this kind of automated system, you're building the solid foundation needed for all the powerful dashboards and insights we'll cover next. Without clean, reliable data, you’re just flying blind. With it, you can finally make decisions that truly move the needle on efficiency and productivity.
Building dashboards that answer real questions
So, you’ve set up your automated data capture. The information is flowing in. But all you have right now is a firehose of raw data, which on its own is just noise. You might feel like you're drowning in details, but none of it actually means anything until you give it some shape.
This is where you turn that stream of data into dashboards that tell a story—and more importantly, answer the real, pressing questions you have about your business.
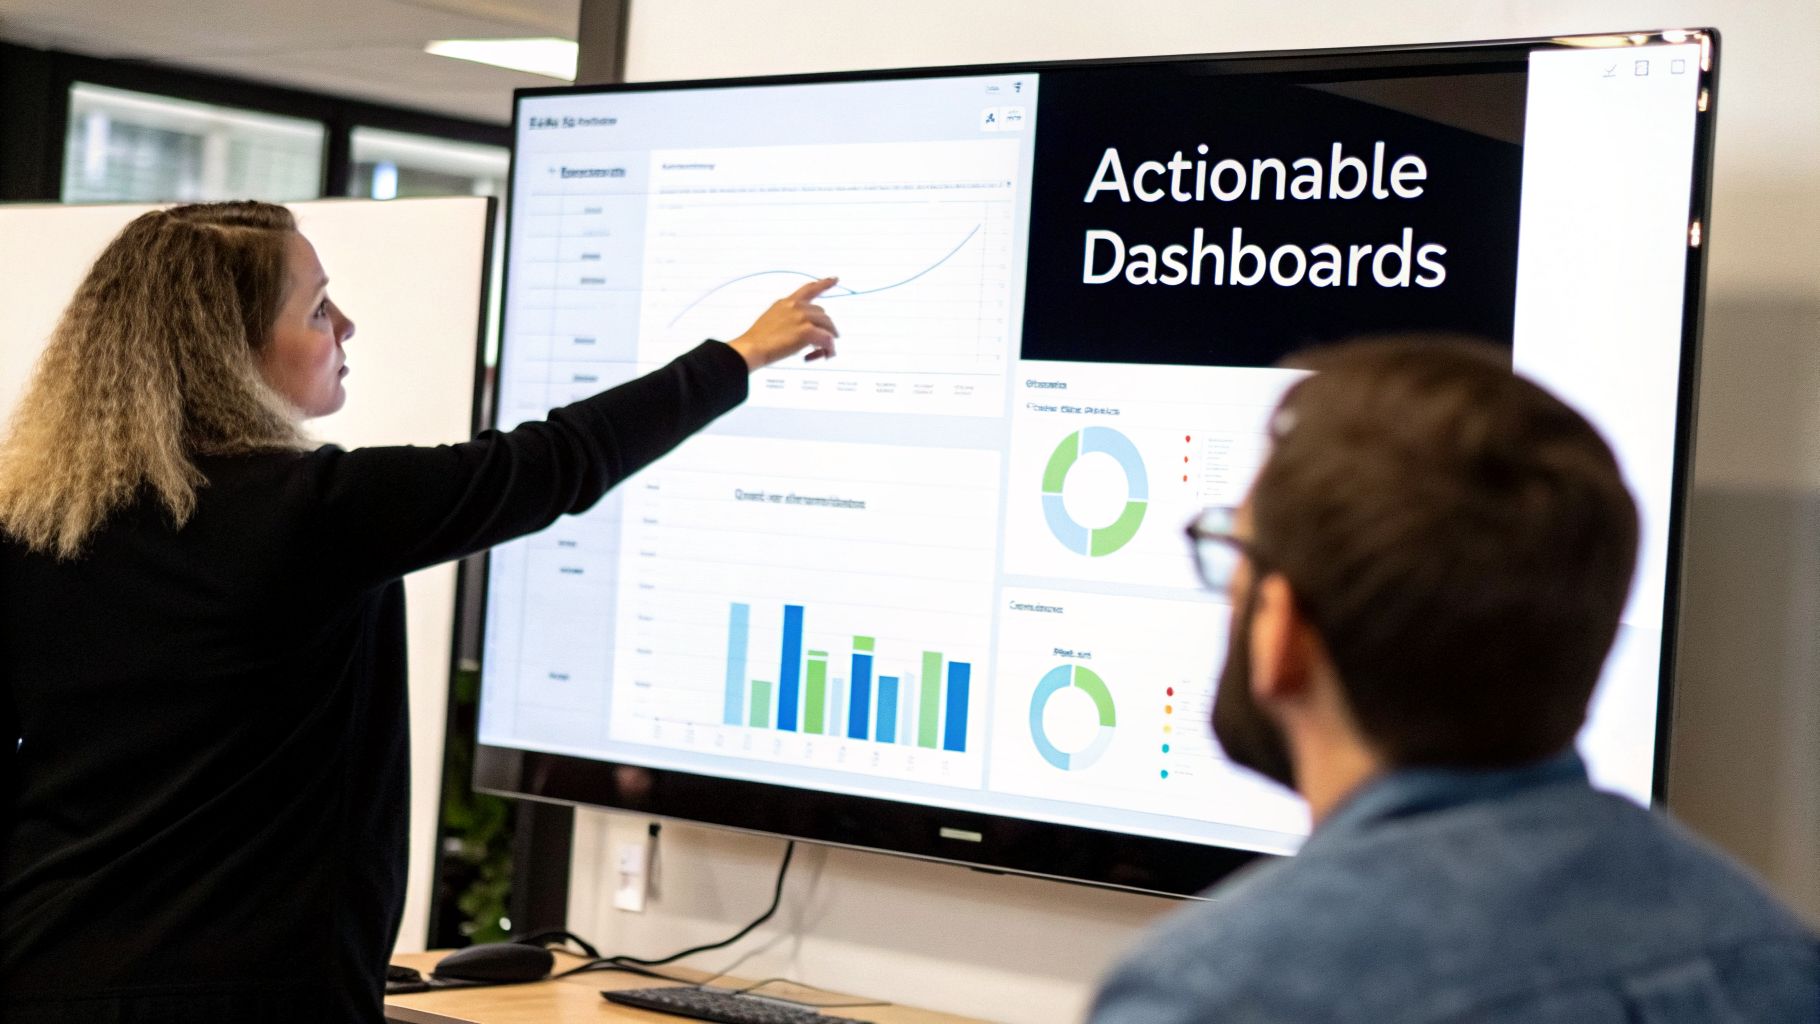
A truly great dashboard doesn’t just spit numbers back at you. It guides your thinking. For anyone in agency operations, that means getting clear, immediate answers on team utilization, project profitability, and client-level ROI. Without that, you’re flying blind.
The secret is in the filters. You absolutely need the ability to slice and dice your data to find the stories hidden inside. This is how you stop just knowing what happened and start understanding why.
Productivity vs. hours-driven teams
Think of your agency as a small economy with its own internal sectors. Some of your teams are all about raw output and productivity, while others are driven by the number of hours they can bill. Neither one is wrong, but you have to know the difference if you want to make smart improvements.
It's a dynamic that plays out on a massive scale. A recent U.S. Bureau of Labor Statistics report showed that from 1990 to 2024, the information sector’s growth was almost all thanks to productivity gains (5.1%), with almost no change in hours worked. Meanwhile, the accommodation and food services sector grew mostly by just throwing more hours at the problem. You can dig into these productivity and hours worked trends on bls.gov.
Your agency isn't so different. Your design team is probably productivity-driven, creating huge value in short, focused bursts. Your account management team, on the other hand, might be more hours-driven, where their value is directly tied to time spent nurturing those client relationships.
A dashboard that can’t tell you the difference between these two models isn’t a dashboard at all—it’s just a spreadsheet. You need to see which teams need better processes to boost productivity and which ones simply need more (or less) time allocated to their work.
Must-have reports for agency operations
To get that kind of clarity, you need to build your dashboards to answer specific, high-stakes questions. Forget the generic charts. Focus on views that point directly to a decision.
From my experience, here are a few reports every agency operations leader needs:
- Team Utilization by Department: This is your direct comparison of billable ratios across teams. When you see the design team is at 85% billable but the dev team is only at 60%, it forces a critical question: "What internal work is bogging down our developers?"
- Project Profitability by Client: Remember, not all revenue is good revenue. This report shows you which clients are true partners and which ones are quietly killing your margins with scope creep and endless feedback loops.
- Non-Billable Time Breakdown: Where do all those non-billable hours actually go? This report needs to break down that time by category (Admin, Sales, Internal Meetings) so you can pinpoint the operational drag and start fixing it.
Building dashboards like these is what turns your data into a genuine strategic asset. Suddenly, you can see which services are most profitable, which teams are the most efficient, and where your internal processes are falling apart. For a look at how these concepts translate into real-world visuals, check out these performance dashboard examples to get your own ideas flowing.
Ultimately, a well-built dashboard closes the loop between collecting data and making decisions. It’s the tool that helps you confidently decide where to invest your resources, what processes to overhaul, and how to steer your agency toward more profitable, sustainable growth.
Alright, you’ve got the dashboards lit up and the data is flowing in. Now for the hard part.
Collecting all this information is one thing, but the real work—and the real payoff—comes from using those insights to make tangible changes in your business. This isn't about tracking for tracking's sake. It's about having smarter conversations and making better decisions that directly impact your bottom line and your team’s well-being.
This is the final piece of the puzzle, where automated tracking connects directly to a healthier, more profitable agency. But it requires a delicate touch.
How to share data without the “big brother” vibe
Let's be honest: rolling out productivity data can feel pretty sketchy to your team. If you handle it wrong, it screams micromanagement. Or worse, surveillance. The trick is to frame the data as a tool for support, not a weapon for judgment.
Your goal is to prove this information helps everyone. When you sit down to review the numbers, focus on team-level trends and patterns, not on calling out individuals.
Here are a few ways to present this data as a win for the team:
- Protecting Their Time: Show them how utilization data is your secret weapon for pushing back on unreasonable client demands or justifying more help on a swamped project.
- Guarding Work-Life Balance: Use the insights to spot burnout risks before they explode. A sudden spike in non-billable hours or weekend work is a red flag you can now act on.
- Making Work Fairer: The data might reveal one person is drowning in non-billable admin tasks while others aren't. This lets you rebalance the workload before resentment builds.
- Justifying Better Resources: It’s much easier to get budget approved for new tools or training when you can show exactly how the current lack of resources is creating inefficiency.
When your team sees that you're using this data to make their lives better, they’ll stop seeing it as a tool of control and start seeing it as a tool for empowerment.
Using data to take strategic action
Once you’ve earned that trust, you can start using your data to make some powerful, proactive changes to the business. Your dashboards will begin to surface crystal-clear opportunities that were previously lost in the day-to-day chaos.
For example, you can now:
- Justify a New Hire with Confidence: Your utilization dashboard shows the design team has been running at 90% billable capacity for three months straight. You no longer have to rely on a "feeling" that they're overworked. You have a rock-solid business case to hire another designer to prevent burnout and take on new work.
- Renegotiate a Draining Project: The project profitability report reveals that "Client C" is consistently running 20% over budget, mostly from endless revision cycles that weren't in the original scope. You can now walk into that conversation with specific data to renegotiate the contract or adjust your pricing.
- Curb Inefficient Internal Meetings: You spot that your senior developers are spending eight hours a week in "internal alignment" meetings, killing their availability for deep, billable work. This gives you a clear mandate to set new meeting rules, like requiring an agenda for every call or making certain stand-ups optional.
This is where the true value of tracking efficiency comes to life. It's not about watching the clock; it's about connecting every data point to a real-world business decision that improves profitability and team health.
Reinvesting your productivity gains back into the team
You must answer the "what's in it for me?" question from your team's perspective. If the agency becomes more efficient and profitable, who actually benefits?
This taps into a much larger conversation around the productivity-pay gap. Since 1979, U.S. productivity has climbed steadily while real hourly compensation has lagged far behind. While productivity and wages grew together at around 2.2% in the 1960s, both slowed to just 0.72% in the 2010s. This shows that workers often don't see the direct financial rewards from efficiency gains. You can read more about the gap between productivity and pay on epi.org.
As an agency leader, you can write a different story. When your data-driven approach starts generating higher profits, reinvesting in your team is one of the smartest things you can do. This doesn't always have to be a direct pay raise, either. It can also look like:
- Better health benefits
- More paid time off
- A dedicated budget for training and development
- Protected "no-meeting" days to allow for deep, focused work
By connecting improved efficiency directly to tangible team benefits, you create a powerful virtuous cycle. The team helps the business become more productive, and in return, the business invests in making their work and lives better. That’s how you build a sustainable, successful agency for the long haul.
Frequently asked questions
Making a change like this always brings up some tough, but fair, questions. It's only natural to be a little skeptical. Let's get into the concerns I hear most often from agency and services leaders when they're thinking about diving in.
How do I get my team on board without it feeling like micromanagement?
This is the question, isn't it? And it's the most important one to get right. No one wants to be Big Brother, and your team will sniff that out a mile away.
The secret is to frame this, from day one, as a tool for team empowerment, not top-down surveillance. It's about protecting their time, not policing it.
You have to be totally transparent about the why. Explain that the goal is to get the data you need to shield them from scope creep, balance workloads, and spot burnout risks before they become a problem. When you can prove a project is under-resourced, you can justify hiring more help. When you show them it's about making their work lives better, they'll see the value.
The most important shift is to emphasize that you're tracking activities against projects and clients, not monitoring keystrokes or watching their every move. The focus is on macro-level insights, not micro-level scrutiny.
This is where an automated, calendar-based system really shines. It kills the soul-crushing drudgery of manual timesheets, which is where most of the resentment comes from. When you start sharing insights, always stick to team and project trends. Never, ever single someone out in a group meeting. Instead, show them, "See? This data is how we're going to push back on that crazy client request." They’ll get on board fast.
Our work is creative and not easily measured in hours. How does this apply to us?
That’s a great point, and it’s one I hear all the time from creative, strategy, and design leads. This isn't about putting a stopwatch on a brilliant idea. It’s about understanding the context in which that creativity happens.
Think of it as protecting the space for that deep, valuable work. You're not counting hours to judge the quality of an idea; you're counting hours to answer strategic questions.
For instance:
- How much time are our senior strategists really losing to new business pitches instead of focusing on billable client work?
- Are our designers getting big, uninterrupted blocks of "deep work" time, or are their days so chopped up by meetings that they can't get in the zone?
- Is one client's endless feedback loop eating up twice the design time as another, even for a similar project?
By tagging time at a high level—think "Client A – Campaign Concepting" or "Internal – Process Improvement"—you're not measuring creativity. You're gathering the evidence you need to kill the administrative noise that suffocates your team's creative capacity.
How long does it take to set up a system like this and see results?
The technical part is surprisingly quick. With a platform designed for this, you can connect your team's calendars and have data flowing in less than an hour. Seriously.
The human side of things is what requires a bit more care. I'd budget about a week to nail down your first set of tags and walk the team through the why and how. You'll start seeing interesting patterns almost immediately—within the first week, you'll have some "aha!" moments.
But the real, game-changing insights? Those take a little longer. To spot reliable trends in project profitability or team utilization, you'll want about one to three months of clean, consistent data. The trick is to start simple. Get the data flowing, learn from it, and then refine your tags and process. The payoff for that initial effort compounds faster than you'd think.
Ready to stop guessing and start knowing where your team's time is going? TimeTackle turns your team's calendars into a powerful source of truth for efficiency and productivity. See how it works and start making data-driven decisions today.