Employee Key Performance Indicators (KPIs) are the numbers that show you how effectively an employee is helping the business hit its most important targets. Don't think of them as a report card. Instead, see them as a GPS for performance, giving everyone clear direction and feedback on how their individual work contributes to the bigger picture. They turn abstract company goals into concrete, trackable data.
What Are Employee KPIs and Why Do They Matter

Imagine trying to drive a car without a dashboard. You’d have no idea about your speed, how much fuel you have left, or if the engine is overheating. Running a business without employee KPIs is just as risky—you're essentially flying blind and just hoping you’re headed in the right direction.
KPIs are the vital instruments that connect high-level company strategy to the day-to-day responsibilities of individual team members. They create that crucial link between daily tasks and long-term success, making sure everyone is pulling in the same direction. Without them, you end up with a team that's busy but not necessarily productive, completing tasks that don’t actually move the needle.
The Difference Between a KPI and a Metric
It's easy to get these two mixed up, but it's vital to know the difference: not every metric is a Key Performance Indicator. A metric is just a measurement of activity—things like the number of emails sent or calls made. A KPI, on the other hand, is a strategic measurement tied directly to a critical business outcome.
For instance, counting the number of articles a content writer produces is a metric. But tracking the "average organic traffic per article" is a KPI because it measures the impact of that work on a core goal, like increasing website visibility.
A metric tells you what happened. A KPI tells you if what happened actually mattered. It’s the difference between counting activities and measuring outcomes.
Getting this distinction right is everything. When you focus on the right employee KPIs, performance reviews stop being about perceived effort and start being about tangible value. This clarity helps leaders make much smarter decisions on everything from promotions and training to where to invest resources.
The Strategic Value of Tracking KPIs
Putting a good KPI framework in place isn't about micromanaging people. It’s about creating alignment and building a culture of accountability and continuous improvement. Done right, KPIs empower everyone.
Here are just a few of the benefits:
- Clear Expectations: Employees know exactly what success looks like in their role. There's no guesswork about how their performance is being evaluated.
- Data-Driven Decisions: Managers can easily spot top performers, identify skills gaps, and offer targeted coaching with objective, fair feedback.
- Improved Engagement: When people see a direct line from their contributions to company success, their sense of purpose skyrockets. This is a core idea that many workforce analytics software platforms are built around.
- Enhanced Agility: With clear data, organizations can spot performance trends early, tackle challenges before they become major problems, and adapt to market changes with much more confidence.
Ultimately, employee KPIs are the foundation of a high-performance culture. They provide the clarity, focus, and data needed to drive real results and build sustainable growth.
The Four Pillars of Meaningful KPIs
Trying to create effective employee KPIs by just picking metrics from a generic list is like trying to bake a cake by throwing random ingredients in a bowl. It just doesn't work. A truly powerful KPI framework needs a solid foundation, built on four interconnected pillars that give you a balanced view of performance. When they work together, these pillars make sure you’re measuring what actually matters for sustainable growth.
Think of it like building a house. If you only focus on one support beam, the whole structure becomes unstable. In the same way, focusing only on one area of performance, like raw output, can cause big problems in other crucial areas, like quality or team morale. A balanced approach is the only way to succeed in the long run.
Productivity and Efficiency
This is usually the most straightforward pillar to measure. It’s all about the volume and speed of work your team gets done. Productivity KPIs answer the simple question: "How much are we accomplishing with the resources we have?" These numbers are vital for understanding your team's capacity, smoothing out workflows, and spotting operational bottlenecks before they become major headaches.
But be careful—productivity alone is a dangerous metric. Pushing for higher output without considering the other pillars can lead straight to burnout, sloppy work, and unhappy clients. It's the "how fast" part of the equation, but it needs to be balanced by the "how well."
Quality and Client Satisfaction
This second pillar is the critical counterbalance to pure productivity. It measures how effective and excellent the work actually is. These employee KPIs get right to the heart of how an employee’s output impacts the end user, whether that’s an internal stakeholder or an external client.
Key metrics here often include things like:
- Error Rate: The percentage of work that has to be redone or corrected.
- Client Retention Rate: The percentage of clients who stick with you over a certain period.
- Customer Satisfaction (CSAT) Scores: Direct feedback from clients on their experience.
High productivity means very little if the quality is poor and clients are walking out the door. This pillar ensures that speed never comes at the expense of excellence, protecting your company's reputation and future.
Financial Impact
The third pillar connects individual and team efforts directly to the company's bottom line. Financial KPIs translate employee activities into real business value, answering the big question: "How does this work contribute to our financial health?" This is where you move from just looking at operational metrics to seeing strategic outcomes.
By linking daily tasks to financial results, you empower employees to see themselves not just as workers, but as direct contributors to the company's success. This fosters a powerful sense of ownership and accountability.
For an agency, this could mean tracking project profitability or billable utilization rates. For a sales team, it might be customer lifetime value (CLV). These numbers make it crystal clear how everyone’s contributions fuel the financial engine of the business. It’s all about achieving better goal alignment between what people do every day and what the company needs to achieve.
Team Engagement and Growth
You could argue this final pillar is the most important one for long-term, sustainable success. It focuses on the health, satisfaction, and development of your people. An unengaged, stagnant workforce will eventually drag down every other area of performance, no matter how great your processes are. This pillar measures morale, professional growth, and overall team stability.
Globally, only 23% of the workforce is truly engaged, and that has massive financial consequences. Disengaged teams have lower sales, get worse customer ratings, and are far less profitable. You can find more on these employee engagement statistics on Cerkl.com. When you track KPIs like employee turnover rate and skills development progress, you’re investing in your most valuable asset—your people.
Actionable KPI Examples for Every Agency Role
Knowing the theory behind KPIs is one thing, but putting it into practice is where the magic happens. Generic lists of performance indicators just don't cut it in a fast-paced agency, where every role is specialized and deeply connected to others. The real trick is picking indicators that zero in on the unique value each person brings to the team.
It’s about moving past simple output metrics. Instead of just tallying up completed tasks, a smart KPI framework measures the impact of those tasks. This shift turns performance tracking from a basic checklist into a powerful tool that connects individual effort directly to the agency's biggest goals.
KPIs for Project and Operations Management
Project Managers are the conductors of the agency orchestra, steering projects from the first kickoff call to the final deliverable. Their success is all about balancing timelines, budgets, and client happiness, so their KPIs need to reflect that high-wire act.
While On-Time Delivery Rate is a classic, a far more telling indicator is Project Budget Adherence. This KPI gets right to the heart of a PM’s ability to manage resources and scope, heading off the dreaded scope creep that can quietly drain profitability.
- What It Is: The percentage of projects wrapped up either within or under their allocated budget.
- Why It Matters: This is a direct pulse check on the agency's financial health and operational smoothness. Nailing budget targets consistently means you’re pricing work correctly and using your team’s time wisely.
- How to Measure It: (Actual Project Cost / Budgeted Project Cost) x 100. The target? Keep this number at or below 100%.
Another vital one is Average Project Turnaround Time. This tracks the full journey from project start to finish. It’s fantastic for spotting bottlenecks in your workflow and gives you a clear sense of team capacity, so you know if you can take on that exciting new client without burning everyone out.
KPIs for Creative and Design Teams
Trying to measure creativity can feel like trying to catch smoke, but it doesn't have to be so abstract. The goal isn't to put a number on inspiration itself, but to measure how efficiently and effectively the creative process is working. Good KPIs for designers focus on collaboration, how well they're synced up with clients, and the overall smoothness of their workflow.
A surprisingly powerful KPI here is the Average Number of Revision Rounds. This metric puts a number on how many back-and-forths it takes before a client gives the final thumbs-up on a design. A low number is a great sign that the designer is a pro at understanding the brief and hitting the mark right from the start.
A low revision count is a strong signal of both creative skill and excellent communication. It means the team is not just producing beautiful work, but the right work, saving valuable time and strengthening client relationships.
Let’s break this one down:
- What It Is: The average number of feedback cycles a design goes through before it gets final approval.
- Why It Matters: Fewer revisions mean more profitable projects because you’re cutting down on non-billable hours. It also shows you really get your clients, which is huge for satisfaction and long-term partnerships.
- How to Measure It: Total Number of Revision Rounds across all projects / Total Number of Projects.
By keeping an eye on this, managers can see where they might need to improve their briefing process or offer extra training, making the whole creative engine run more smoothly.
KPIs for Account and Sales Management
For the folks in account and sales roles, performance is all about relationships and revenue. Their KPIs need to reflect their knack for keeping current clients happy while also sniffing out and grabbing new opportunities for growth.
Client Retention Rate is the bedrock KPI here, measuring the percentage of clients you hang onto over time. It’s a huge indicator of client satisfaction and the overall health of your business. After all, landing a new customer can be five times more expensive than keeping an existing one, so this metric is absolutely critical.
Another key one is Upsell and Cross-sell Revenue, which tracks the extra cash you bring in from existing clients by offering them new services or bigger projects. This shows an account manager is more than just a service provider—they’re a trusted strategic partner. These are just a starting point; you can find other essential sales metrics that highly productive teams track to build a really solid measurement framework.
To give you a clearer picture, here’s how these KPIs might look across different agency roles:
Role-Based KPI Examples for Agencies
This table breaks down some key performance indicators for common roles you’d find in a marketing, creative, or consulting agency, complete with simple formulas to get you started.
| Role | Primary KPI | How to Measure | Why It Matters |
|---|---|---|---|
| Project Manager | Project Budget Adherence | (Actual Cost / Budgeted Cost) x 100 | Measures financial control and resource efficiency. |
| Graphic Designer | Average Revision Rounds | Total Revisions / Total Projects | Indicates alignment with client vision and creative efficiency. |
| Content Writer | Content Performance | (e.g., Engagement Rate, Conversion Rate) | Connects content creation directly to business impact. |
| SEO Specialist | Organic Traffic Growth | % Increase in Organic Sessions MoM | Directly shows the effectiveness of search optimization efforts. |
| Account Manager | Client Retention Rate | (# Retained Clients / # Total Clients) x 100 | Reflects client satisfaction and long-term business stability. |
| Sales Executive | New Business Revenue | Total Revenue from New Clients | Tracks direct contribution to agency growth. |
Using role-specific KPIs like these helps everyone understand exactly how their work contributes to the bigger picture, creating a more focused and motivated team.
KPIs for Team Health and Engagement
Finally, you can't forget about the people. Across every role, it's crucial to track indicators of team well-being and engagement. These metrics are often pushed to the side, but they have a massive impact on everything from productivity and quality to retention. A checked-out team will eventually drag performance down, no matter how perfect their other KPIs are.
A big one to watch is the Employee Turnover Rate. High turnover isn't just disruptive; it's expensive and often points to deeper issues with management, workload, or company culture. Tracking it helps you spot problems and fix them before you lose your best people.
When thinking about these KPIs, specialized tools like employee engagement software can be a huge help in tracking metrics that give you a real sense of your team's morale and productivity. When you measure engagement, you're getting a sneak peek at future performance and the overall stability of your agency.
How to Implement and Track KPIs Successfully
Coming up with a sharp list of employee KPIs is a great start, but it’s only half the battle. The real magic happens during implementation—how you introduce, track, and talk about these metrics with your team. A thoughtful rollout can turn performance tracking from a top-down chore into a genuine tool for growth.
Without a solid game plan, even the best-designed KPIs can fall flat, leading to confusion, disengagement, or even resentment. The goal is to build a system that feels supportive, not like a micromanagement tool in disguise. This takes clear communication, the right tools, and a focus on coaching over criticism.
Align KPIs with Broader Company Goals
The most effective employee KPIs never exist in a vacuum. They need a direct, visible line connecting them to the company's bigger strategic goals, like your quarterly Objectives and Key Results (OKRs). This alignment is critical because it gives individual work a powerful sense of purpose.
Think of it like a rowing team. If each rower just tries to paddle as fast as they can without considering the boat's direction, they'll create chaos. But when every single rower’s effort is aligned with the shared goal of winning the race, their combined power creates unstoppable, synchronized momentum.
When an employee can see exactly how their daily tasks push a major company milestone forward, their motivation and sense of ownership skyrocket. Their job transforms from a list of duties into a meaningful mission.
Make Every KPI SMART
For a KPI to work, it has to be crystal clear to everyone involved. The SMART framework is the gold standard for getting that clarity. It’s a simple but powerful checklist to make sure your KPIs are well-defined and ready for action.
- Specific: Is the goal clear? Instead of "Improve client happiness," go with "Increase the Q3 Net Promoter Score (NPS)."
- Measurable: Can you put a number on it? "Increase NPS from 45 to 55" gives everyone a clear target.
- Achievable: Is the goal realistic? Setting an impossible target just crushes morale before you even start.
- Relevant: Does this metric actually move the needle for the business? It has to tie back to those broader company goals we just talked about.
- Time-bound: Is there a deadline? "Increase NPS from 45 to 55 by the end of Q3" creates focus and a healthy sense of urgency.
Applying this framework to every single KPI takes the guesswork out of the equation and sets your team up to win from day one.
Establish Reliable Data Sources and Automation
Tracking KPIs manually is a surefire way to get bad data and burn out your managers. The key to sustainable tracking is to automate data collection from the systems your team already lives in every day—your calendars, project management software, and CRMs.
This flow chart shows how different roles in an agency connect their core activities to measurable performance indicators.
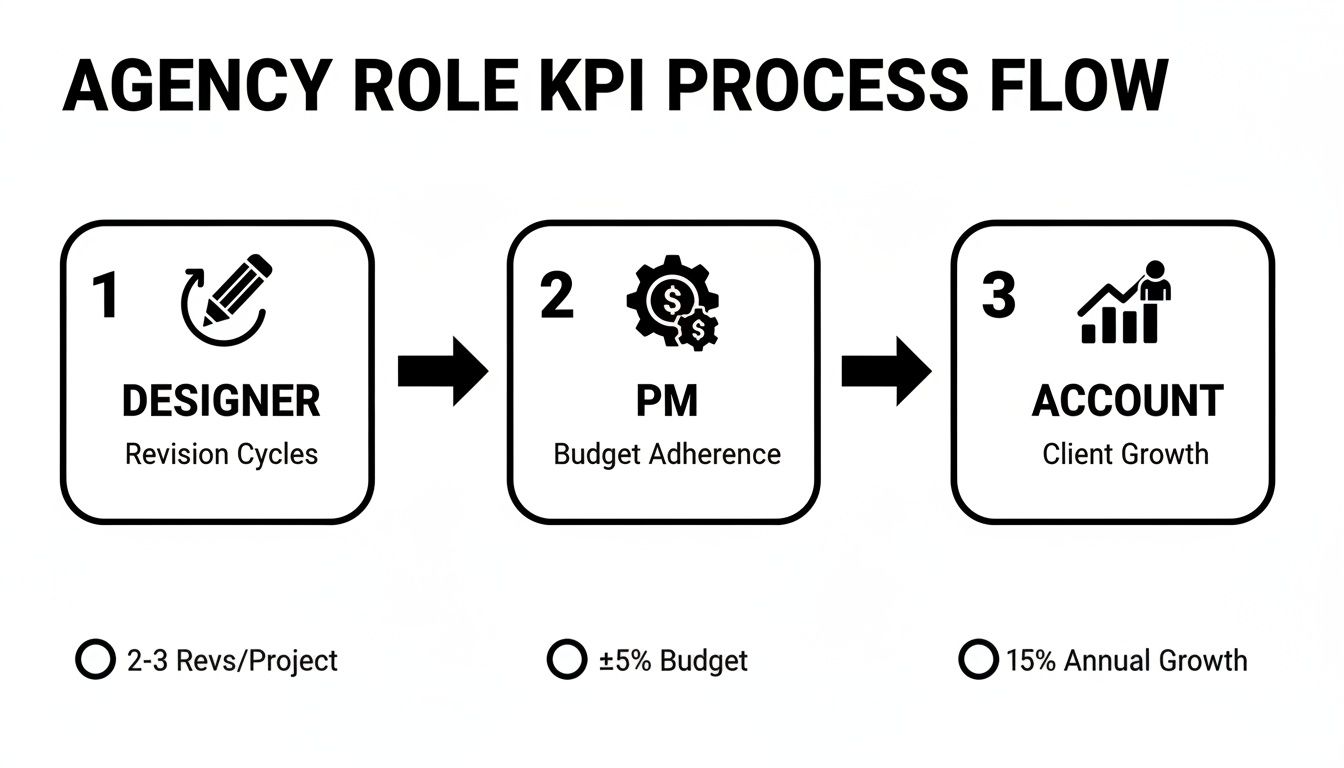
You can see how a designer's revision cycles, a PM's budget oversight, and an account manager's client growth efforts are all distinct but interconnected parts of delivering value.
By pulling data directly from the source, you get a much more accurate and objective picture of performance without adding the headache of manual timesheets. For example, a KPI like Utilization Rate is the lifeblood of agencies, with most aiming for a 70-80% target. Automating this metric by analyzing calendar data gives leaders the real-time oversight they need to hit these critical numbers.
Set Realistic Benchmarks and Foster a Coaching Culture
Once you have your KPIs and data sources locked in, the final piece of the puzzle is using them effectively. This is where a lot of managers trip up. KPIs should be the start of a productive conversation, not a weapon for judgment.
Your implementation process should look something like this:
- Set Baselines: Before you set targets, measure where things stand right now. This gives you a realistic starting point.
- Communicate Clearly: Get the team together and explain the why behind the new KPIs. Emphasize that these are tools for growth, not for punishment.
- Schedule Regular Check-ins: Performance conversations shouldn't be a once-a-year surprise. Quick, regular check-ins (weekly or bi-weekly) create a continuous feedback loop.
- Focus on Coaching: When a KPI is off track, the first question should always be, "How can I help?" Use the data to spot challenges, find resource gaps, or identify training needs.
To wrap this all together, think about adopting a modern performance management process that builds on these ideas. It shifts the focus from just evaluating performance to developing your people, which is how you build a stronger, more resilient team for the long haul.
Automating Your KPI Reporting and Analytics
Let's be honest: manual KPI tracking is a soul-crushing exercise. It’s not just tedious; it's a colossal waste of your most precious resource—time. When your best people are stuck wrestling with spreadsheets, chasing down timesheets, and trying to stitch together data from a dozen different places, they aren't leading. They aren't strategizing. They certainly aren't creating.
This manual grind is a breeding ground for human error, creating huge delays in reporting. By the time you finally see the numbers, the picture they paint is already a relic of the past.
Trying to keep up with the pace of modern business using old-school tracking methods just doesn't work. It's like trying to navigate a six-lane highway by only looking in the rearview mirror. You're constantly reacting to what's already happened instead of proactively shaping what's next.
The Power of Calendar-Driven Data
There's a much smarter, more accurate way to do this. Instead of relying on flawed, self-reported timesheets that everyone secretly hates filling out, you can tap into a data source your team already uses with pinpoint accuracy: their calendars. Every client call, team sync, and focused work block is already there, creating a rich, objective record of where time actually goes.
This calendar-driven approach gives you a ground truth for team activity that manual entry could never hope to match. It automatically pulls in the raw data needed to measure critical employee KPIs without adding a single administrative task to anyone's plate.
By connecting your team's calendars to an analytics tool, you transform a simple scheduling utility into a powerful, automated engine for performance insights. All activities are captured and categorized against projects and clients automatically, eliminating guesswork and administrative overhead.
Bringing Your KPIs to Life with Dynamic Dashboards
Once the data is flowing in automatically, the next step is making it dead simple to understand. This is where dynamic dashboards come into play, visualizing your most important employee KPIs in real-time. Say goodbye to static, clunky reports and hello to instant, interactive views into how your team is performing.
With a platform like TimeTackle, you can build custom dashboards that highlight the exact metrics you care about, such as:
- Team Utilization Rate: Instantly see which teams are swamped and who has room for more, leading to much smarter resource allocation.
- Project ROI: Get a crystal-clear picture of profitability by tracking the actual time invested against project revenue.
- Billable vs. Non-Billable Hours: Finally understand exactly how much time is spent on revenue-generating activities versus internal tasks.
This is what it looks like in action. This dashboard from TimeTackle gives you a clean, intuitive look at key productivity metrics pulled straight from calendar data.

You can see how the platform neatly breaks down time spent by category, project, and team member, giving you at-a-glance insights into where all the effort is going.
This level of real-time visibility is a game-changer. It gives managers the power to spot trends as they emerge, tackle potential issues before they become full-blown problems, and have more meaningful, data-backed conversations with their teams. The focus shifts from chasing down information to actually using it to make better decisions. Automation doesn't just save time—it creates the clarity you need to drive real performance improvement across the board.
Common KPI Mistakes You Need to Avoid
Rolling out a new set of employee KPIs is a big step, but it's also a path loaded with potential tripwires. If you just throw a bunch of metrics at your team without a solid strategy, you can create more confusion and anxiety than clarity and growth.
Getting this right isn't just about picking the perfect KPIs; it's also about sidestepping the common blunders. A poorly planned KPI system can easily turn into a source of stress instead of a tool for empowerment, completely undermining what you wanted to achieve in the first place.
Focusing on Vanity Metrics
One of the easiest traps to fall into is fixating on vanity metrics. These are the numbers that look great in a report but don’t actually help you make smarter business decisions. Think "social media followers" versus "lead conversion rate from social media." One is easy to pump up, but the other tells you what's actually working.
To dodge this, ask a simple question for every KPI you're considering: "Will this number help us make a better decision?" If the answer is a clear no, you're probably looking at a vanity metric that will just add noise and pull your team's focus away from what really drives the business forward.
The point of a KPI isn’t just to track activity; it’s to measure progress toward a real outcome. When you focus on outcomes over outputs, you build trust and give your team the freedom to solve problems their way.
Overwhelming Teams with Too Many KPIs
When it comes to performance indicators, more is definitely not better. Loading up an employee with ten different KPIs is a recipe for paralysis. Their focus gets scattered, and it becomes nearly impossible to figure out which tasks will actually make a difference.
Stick to the "less is more" rule here. For any given role, aim for 3-5 core KPIs. This forces you to get crystal clear on what truly defines success, giving both the employee and their manager a manageable and focused set of priorities.
Using KPIs for Micromanagement
This is probably the most destructive mistake of all: turning performance data into a surveillance tool instead of a foundation for coaching. When KPIs are used to poke and prod every little task, trust evaporates, and you end up with a culture of fear. This approach always backfires, tanking morale and engagement.
The financial hit from getting this wrong is huge. Losing a great employee can cost an agency 1.5-2x their salary, and engaged teams see 43% lower turnover. You can dig deeper into the high cost of disengagement in this employee engagement intelligence report from Blink. The best leaders use KPIs to open up supportive conversations, find out what's getting in the way, and help their people win.
Got questions about employee KPIs? You're not alone. It’s easy to get tangled up in the details of how many to set, how often to check them, and how they differ from other goal-setting frameworks. Getting it right is the key to a system that motivates your team instead of making them feel buried in metrics.
Let's clear up some of the most common questions managers have.
How Many KPIs Should an Employee Have?
When it comes to KPIs, less is absolutely more. Stick to three to five key indicators for any single role.
This small number forces you to get crystal clear about what truly drives success. It stops employees from feeling pulled in a dozen different directions and helps them focus their energy on the activities that make the biggest impact.
How Often Should We Review KPIs?
A mix of check-in cadences usually works best. Quick, informal weekly chats are great for tracking progress on short-term goals and knocking down any immediate roadblocks.
Then, pair those with more formal quarterly reviews. These are your chance to zoom out and have a deeper, more strategic conversation about performance trends, goal adjustments, and long-term professional growth. This rhythm keeps KPIs from getting stale and ensures they stay relevant.
Think of it like a car's dashboard. KPIs are your steady gauges—oil pressure, engine temperature—that monitor ongoing health. OKRs are the GPS, plotting an ambitious new destination and guiding you turn-by-turn.
What Is the Difference Between KPIs and OKRs?
This is a classic point of confusion, but they really serve two different purposes. KPIs are your business-as-usual metrics; they monitor the ongoing health and efficiency of your core activities.
Objectives and Key Results (OKRs), on the other hand, are all about driving ambitious change. They are usually set for a quarter to rally everyone around a new, challenging goal. The two work together perfectly: solid KPIs build a stable foundation, which then gives you the confidence to chase aggressive OKRs.
How Do You Measure Performance for Creative Roles?
Measuring creative work isn't about counting widgets. You have to shift your focus from raw output to the process and its ultimate impact.
Instead of just tracking the number of designs finished, try using a KPI like Average Revision Rounds to see how efficiently your team is aligning with client needs. You can also tie their work directly to business outcomes by tracking client-centric metrics like the Net Promoter Score (NPS) for projects they were on.
Ready to stop chasing timesheets and start getting clear, automated insights into your team's performance? TimeTackle transforms your calendar data into powerful, real-time dashboards for utilization, project ROI, and more. See how it works at https://www.timetackle.com.