To figure out your operating expenses, you're essentially adding up all the costs that keep your business running day-to-day but aren't directly baked into the product or service you sell. This means things like rent, utilities, marketing budgets, and the salaries of your administrative staff.
Simply put, it’s the cost of keeping the lights on.
What Are Operating Expenses, Really?

Before we start plugging numbers into formulas, let's get a real feel for what operating expenses (often just called OpEx) are all about. They represent the ongoing, necessary costs a company has to pay just to exist and support its main business activities. Getting this right is a huge indicator of your operational efficiency and overall financial health.
Honestly, tracking these costs is more than just an accounting chore; it's a strategic must-do. When you have an accurate picture of your OpEx, you can build realistic budgets, pinpoint where you might be overspending, and make much smarter calls on where to put your resources. If you don’t have a solid handle on these numbers, you’re basically flying blind.
Distinguishing OpEx from Other Costs
One of the biggest hang-ups I see is the confusion between operating expenses and two other major cost buckets: Cost of Goods Sold (COGS) and Capital Expenditures (CapEx). It's easy to mix them up, but they serve very different purposes.
To make this crystal clear, here’s a quick breakdown that separates these key business costs.
Operating Expenses at a Glance
| Expense Type | Definition | Example |
|---|---|---|
| Operating Expenses (OpEx) | The day-to-day costs of running the business, not tied to a specific product. | Rent, marketing campaigns, office supplies, sales commissions. |
| Cost of Goods Sold (COGS) | The direct costs of creating the products or services you sell. | Raw materials like flour for a bakery, or server costs for a SaaS company. |
| Capital Expenditures (CapEx) | Major, long-term investments in physical assets. | Buying a new building, a fleet of vehicles, or heavy machinery. |
Getting this distinction right is the first and most critical step. For instance, the salary you pay your marketing manager is OpEx, but the wages for a factory worker assembling your product fall under COGS. If you want to get even more precise in how you assign these costs to specific business activities, you might want to look into more advanced methods. To learn more about this, check out our guide on what is activity-based costing.
The Real-World Impact on Profitability
Managing your OpEx well isn't just about tidy bookkeeping—it has a direct and powerful effect on your bottom line. Every single dollar you manage to save in operating costs is another dollar that drops straight to your operating income. It’s one of the most straightforward ways to boost profitability.
The global scale of these costs is staggering. One recent analysis projected a $1.2 trillion rise in corporate expenses for 2025, which could lead to a massive $907 billion loss in profits for companies around the world.
This just goes to show how incredibly sensitive profit margins are to even minor shifts in operational spending. For large companies, these rising costs can squeeze global corporate margins, forcing them to either absorb the hit or pass the price increase on to customers. This makes knowing how to calculate and control your operating expenses not just good practice, but an absolutely essential part of a sustainable business strategy.
Choosing Your OpEx Calculation Method
When it's time to actually calculate your operating expenses, you have two reliable paths you can take. They both get you to the same answer, but your choice often boils down to a simple question: which financial data is easiest for you to grab?
One method is a direct, bottoms-up approach, while the other works backward from your income statement. Let's walk through both so you can pick the one that fits best with your current bookkeeping.
The Direct Method: Summing It All Up
The most straightforward way to nail down your OpEx is to simply add up every single operating cost your business paid for over a certain period. This is the direct method. Think of it as building your total from the ground up, one expense at a time.
You’d gather all the records for costs not directly tied to making your product or delivering your service. This includes things like:
- Administrative Salaries: Pay for your office manager, HR team, and executives.
- Rent and Utilities: The monthly cost for your office space, electricity, and internet.
- Marketing and Advertising: All your campaign spending, software subscriptions, and ad placements.
- Office Supplies: Everything from printer paper and pens to the coffee in the break room.
- Insurance: Premiums for business liability or property insurance.
This method requires you to be on top of your record-keeping, but the payoff is a crystal-clear, granular view of exactly where your money is going.
For any service-based business, meticulously tracking employee time is a huge piece of this puzzle. It helps you correctly allocate salary costs. Properly calculating billable hours is key to separating direct project costs (COGS) from general administrative time (OpEx).
The Indirect Method: Working Backwards From Revenue
If you already have a prepared income statement but maybe not a line-by-line list of every single expense, the indirect method is your friend. It uses the key figures right from your financial statement to calculate OpEx.
The formula is clean and simple:
Operating Expenses = Revenue – Operating Income – COGS
Let’s quickly break that down:
- Revenue: This is the top-line number—the total amount of money your business brought in from sales.
- Operating Income: Your profit after subtracting both COGS and OpEx from your revenue.
- COGS (Cost of Goods Sold): These are the direct costs tied to producing your goods or services.
With this formula, you’re essentially isolating the OpEx figure by removing everything else from your total revenue. It's a top-down approach that's quick and efficient if you have the right reports on hand.
Seeing Both Methods in Action
Let's make this real. Imagine a small software company looking at its quarterly financials:
- Total Revenue: $200,000
- Operating Income: $50,000
- COGS (server costs, developer wages): $60,000
If they use the indirect formula, the math is simple:
$200,000 (Revenue) – $50,000 (Operating Income) – $60,000 (COGS) = $90,000 in Operating Expenses.
Now, what if they used the direct method instead? They would add up their individual Selling, General & Administrative (SG&A) costs. Maybe that’s $45,000 in sales and admin salaries, $25,000 in marketing, $15,000 in rent, and $5,000 in various software subscriptions.
Add it all up, and you get… $90,000.
See? Both paths lead to the same destination. This is a core accounting principle in action—different formulas are just different ways of telling the same financial story. An analysis of one company's income statement showed that combining all their Selling, Operating, General, and Administrative expenses resulted in Total Operating Expenses of $854,159, proving just how these costs are summed up in real-world financial reporting. You can discover more insights about operating expense formulas on FreshBooks.com.
Gathering and Organizing Your Financial Data
Any calculation is only as good as the data you feed it. For operating expenses, that means getting your financial information in order is mission-critical. Before you even think about plugging numbers into a formula, you need a clean, complete set of data pulled from all the right places.
Think of it as gathering your ingredients before you start cooking. Your main sources of truth will be:
- Accounting Software Reports: Your Profit and Loss (P&L) statement is the MVP here.
- Bank and Credit Card Statements: These are fantastic for catching every single transaction, making sure nothing slips through the cracks.
- Payroll Records: Absolutely essential for tracking what is often your biggest OpEx category—salaries.
- Invoices and Bills: This is the paper trail for everything from your utility bills to software subscriptions.
Solid documentation is what separates a vague estimate from a reliable calculation. Knowing your way around financial records, even something as simple as understanding generic POS receipt templates, helps you organize everything much more effectively.
This diagram lays out the two core methods for calculating OpEx we've talked about.
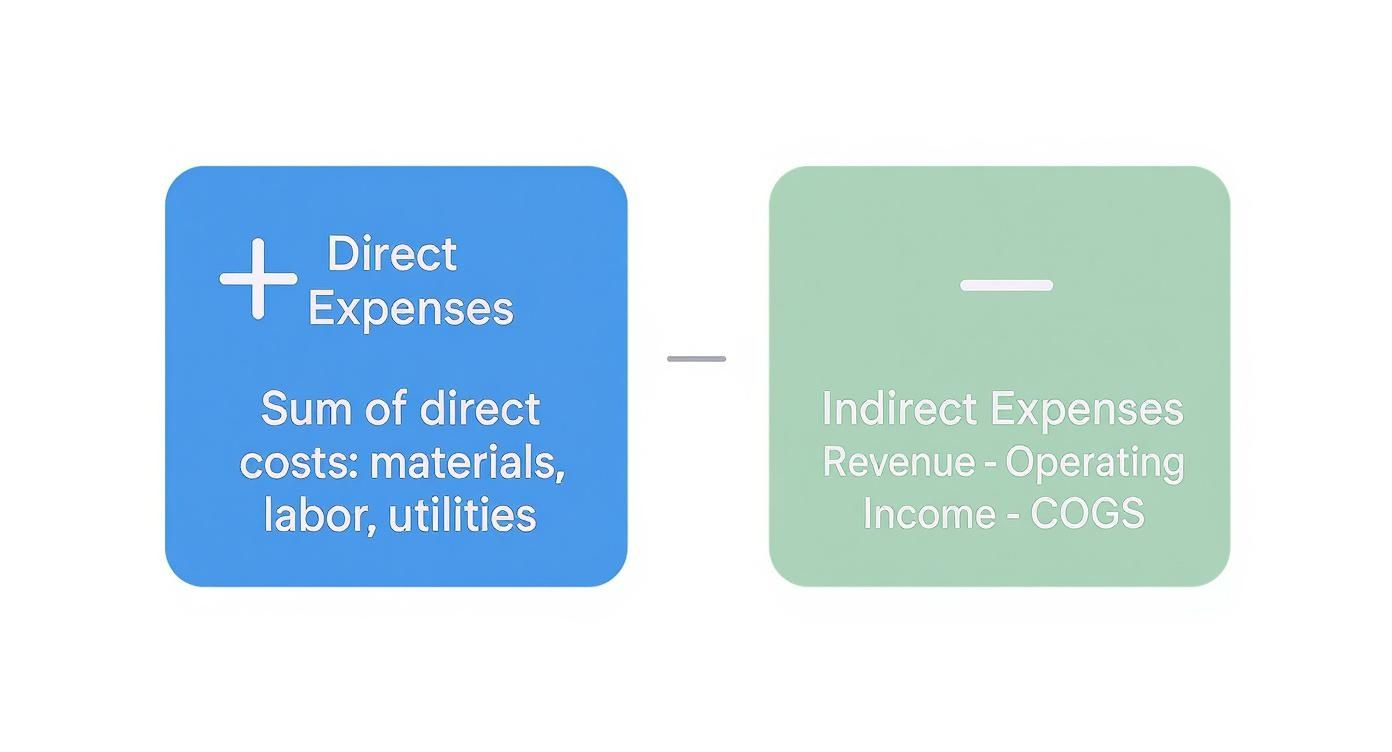
It’s a great visual reminder that whether you add up all the individual expenses or subtract other costs from revenue, you should land on the same number.
Allocating Costs with Precision
Now for the tricky part: allocation. What do you do with costs that serve multiple purposes? A classic example is an employee's salary. Let's say your lead designer spends half her time on client projects (which sounds like COGS) but the other half on internal branding and marketing materials (which is definitely OpEx). How do you split that cost?
This is where time data becomes your secret weapon. By looking at how your team actually spends their time, you can slice up salary costs with incredible accuracy. Doing this by hand is a complete non-starter, but modern tools can handle it automatically.
For instance, if you hook up employee calendars to a platform like TimeTackle, you can see exactly how time is being spent. If a project manager's calendar data shows 60% of their hours were in client-facing meetings (COGS) and 40% were spent on internal admin and team management (OpEx), you can allocate their salary cost along those same lines. Simple as that.
Pro Tip: Don’t stop at salaries. You can apply this same thinking to software licenses (is your design tool used for client work or internal marketing?) or even rent, if you can assign floor space to different departments.
Using Calendar Data for Smarter OpEx Allocation
Let's walk through a real-world scenario. Picture an agency that wants to understand the true operating cost of its administrative team versus its client-facing delivery teams.
By tapping into calendar data, you can get a clear, automated breakdown of how time is being divided across different functions and projects.
Instead of relying on gut feelings or rough estimates, you get a data-backed, defensible way to allocate your biggest expenses. This makes your final OpEx calculation far more accurate and turns a fuzzy accounting problem into a straightforward, actionable process.
Understanding this breakdown is also crucial for benchmarking against industry-specific costs. Take business travel, a massive slice of OpEx for many companies. Global spending in this area is expected to hit a staggering $1.57 trillion in 2025. The U.S. ($395.4 billion) and China ($373.1 billion) are leading the charge, making up 58% of the spending in the top 15 markets alone.
Calculating OpEx: A Real-World Walkthrough
Theory only gets you so far. To make this real, let's walk through a detailed example for a fictional consulting firm we'll call "Innovate Solutions." This will show you exactly how to calculate operating expenses with the kind of numbers you’d see in your own business.
We'll start with their monthly expense report—a simple list of everything they paid for that isn't a direct cost of delivering their consulting services.

Innovate Solutions' Monthly Expenses
Here’s a snapshot of the costs that keep Innovate Solutions humming for one month. These are classic examples of Selling, General & Administrative (SG&A) expenses.
- Salaries (Admin & Sales): $25,000
- Office Rent: $7,000
- Utilities (Internet, Electricity): $1,200
- Marketing & Advertising: $4,500
- Software Subscriptions (CRM, Accounting): $800
- Insurance: $500
- Office Supplies: $300
- Professional Services (Legal, Accounting): $1,000
This list gives us all the data we need to jump right into the direct calculation.
Calculating OpEx with the Direct Method
Using the direct method is as simple as it sounds: just add up all the individual operating costs you've identified. It’s a straightforward summation that gives you a crystal-clear, itemized view of your spending.
For Innovate Solutions, the math looks like this:
$25,000 + $7,000 + $1,200 + $4,500 + $800 + $500 + $300 + $1,000 = $40,300
So, their total monthly operating expense is $40,300. This approach is perfect when you have detailed records and want to see exactly where every dollar is going.
Calculating OpEx with the Indirect Method
Now, let's double-check this number using the indirect method, which works backward from the income statement. This is a handy technique when you have high-level financial reports but maybe not a neatly itemized expense list.
Here are the key figures from Innovate Solutions' monthly income statement:
- Total Revenue: $100,000
- Cost of Goods Sold (COGS): $35,000 (This includes consultant salaries for direct client work)
- Operating Income: $24,700
The formula here is: Revenue – COGS – Operating Income = OpEx
Let's plug in their numbers:
$100,000 – $35,000 – $24,700 = $40,300
As you can see, both roads lead to the same destination: $40,300. This confirms our accuracy and shows how different accounting paths can reveal the same financial truth.
Getting a handle on these numbers is the first step toward optimizing them. For many service firms, a huge chunk of both COGS and OpEx is tied up in salaries, making it critical to understand how your team's time translates into value. A deeper dive can shed light on your project management costs and pinpoint exactly where you can find operational efficiencies. By mastering both calculation methods, you gain the flexibility to assess your business's financial health quickly and confidently.
Common OpEx Calculation Mistakes to Avoid
Calculating operating expenses can feel straightforward, but even tiny errors can ripple through your financial analysis, leading to some seriously misguided business decisions. I've seen it happen. Knowing where people usually trip up is the best way to make sure your numbers are solid, reliable, and actually tell you something useful about your company's health.
One of the most common blunders is simply misclassifying expenses. It's surprisingly easy to accidentally toss a direct cost, like the raw materials for a product, into your OpEx bucket. That's a Cost of Goods Sold (COGS), not an operating expense. This one mistake artificially blows up your OpEx and shrinks your gross profit margin, giving you a warped view of your core profitability.
Another classic slip-up? Overlooking the little things. I'm talking about those small, recurring costs that quietly bleed your budget dry. Think about that software trial that auto-renewed into a monthly subscription or the small bank service fees on every statement. They seem minor on their own, but they can add up to a shocking amount over a year. Forgetting them means you're understating what it truly costs to keep the lights on.
Forgetting Non-Cash Expenses
It’s not just about the cash flowing out of your bank account. You have to account for non-cash expenses like depreciation and amortization. These are legitimate operating costs.
Depreciation, for instance, reflects the gradual loss of value of physical assets like company vehicles or machinery. If you forget to factor it in, your business will look much more profitable on paper than it actually is. This can lead to some painful downstream consequences, like setting wildly unrealistic budgets or making bad investment decisions based on phantom profits.
A critical mistake I see all the time is using inconsistent time periods for data. If you pull revenue figures from one quarter but use expense data from another, your calculations are completely meaningless. Consistency is the bedrock of accurate financial reporting.
Inaccurate Data from Unreliable Tools
Finally, be careful about putting blind faith in generic online calculators. These tools are often too simplistic to handle the unique quirks of your business. They rely on broad assumptions that can easily lead you down the wrong path with flawed numbers. It’s worth understanding the pitfalls of relying on online rental calculators to see just how misleading these tools can be.
At the end of the day, the goal here is clarity. By sidestepping these common errors, you build a trustworthy financial foundation that supports smarter, more strategic decisions. The diligence you put in now will pay dividends for years to come.
Common Questions About Operating Expenses
As you start digging into your operating expenses, you’ll inevitably run into some gray areas. The formulas are one thing, but real-world business scenarios rarely fit into a neat little box. Let’s tackle some of the most common questions that pop up when business owners start calculating their OpEx.
Getting these details right is the difference between just crunching numbers and actually understanding the story your finances are telling.
Are Employee Salaries Always an Operating Expense?
Most of the time, yes—but this is a critical distinction. Salaries for your administrative staff, marketing team, and managers are textbook operating expenses. Why? Because they support the day-to-day running of the business.
But here’s the catch: wages for employees who are directly involved in creating your product or service fall under the Cost of Goods Sold (COGS).
For example, a software developer’s salary is COGS because they are building the product. The marketing manager who promotes that product? Their salary is a clear operating expense.
How Often Should I Calculate Operating Expenses?
For the best financial pulse-check, you should be calculating your OpEx monthly. This rhythm lets you spot spending trends as they happen, catch any weird cost spikes early, and adjust your budget before a small leak becomes a big problem.
At the very least, you need to run the numbers quarterly and annually for formal financial reporting and tax prep. But waiting that long means you're looking in the rearview mirror.
A consistent, monthly review gives you a much richer, more accurate picture of your company's performance. It turns accounting from a reactive chore into a proactive, strategic tool.
Is a Spreadsheet Good Enough for Tracking OpEx?
Absolutely. For a lot of small businesses, a well-organized spreadsheet is the perfect starting point. You can easily set up columns for the date, expense category, vendor, and amount, then use simple formulas to get your totals. It’s a straightforward and effective way to get a grip on your spending.
Of course, as your business grows and transactions get more complex, you'll probably want to graduate to dedicated accounting software. Those platforms offer more muscle for tracking, reporting, and automation that can save you a ton of time.
What Is the Operating Expense Ratio and Why Does It Matter?
The operating expense ratio (OER) is a crucial metric that shows you just how efficient your business is. You find it by dividing your total operating expenses by your total revenue. The result is a percentage that tells you how much it costs to run the show for every dollar you bring in.
- Formula: OER = Total Operating Expenses / Total Revenue
- Purpose: Measures the efficiency of your core business operations.
- Insight: A lower ratio is a great sign—it generally signals better efficiency and profitability.
Tracking your OER over time and stacking it up against industry benchmarks gives you powerful feedback on your company's financial health. It helps you answer the big question: "Are we running this business as lean as we should be?"
Ready to get a crystal-clear view of how your team’s time impacts your operating expenses? TimeTackle uses AI to analyze calendar data, helping you accurately allocate salary costs and uncover operational insights without the hassle of manual timesheets. See how much time—and money—you can save. Discover TimeTackle today.