Measuring operational efficiency is all about looking at what you put into your work versus what you get out of it. We're talking about inputs like cost, time, and labor stacked up against outputs like revenue or finished projects. It’s the clearest way to see how well you're turning resources into actual results.
But this isn't just about crunching numbers. Mastering this is how you build a resilient, agile business that can handle whatever comes its way.
Why Measuring Operational Efficiency Is Your Competitive Edge
A lot of leaders hear "operational efficiency" and immediately think it's just a fancy term for aggressive cost-cutting. While trimming expenses can be a nice side effect, that's not the main goal. The real prize is maximizing the value you get from every dollar spent and every single hour worked.
It’s about ditching clunky, outdated processes for smart, streamlined workflows that actually help your team succeed. When you really get a handle on measuring efficiency, you shift the entire company's mindset from just doing stuff to doing the right stuff, the right way.
This shift is what fuels profitability, makes it possible to scale, and even boosts customer satisfaction. Think about it: an efficient business hits its deadlines, makes fewer mistakes, and keeps budgets on track. Those aren't just internal high-fives; they translate directly into a better experience for your clients.
Before we dive deeper, it's crucial to grasp the fundamental components we're measuring. At its core, operational efficiency breaks down into a simple input-versus-output model.
Core Components of Operational Efficiency Measurement
| Measurement Component | Definition | Examples |
|---|---|---|
| Inputs | The resources you invest to produce a good or service. | Employee hours, software costs, office rent, raw materials, marketing spend. |
| Outputs | The final products, services, or revenue generated from your inputs. | Completed projects, units sold, monthly recurring revenue (MRR), new customers. |
| Metrics | The formulas or KPIs that compare inputs to outputs. | Labor Efficiency Ratio, Operating Margin, Cost of Goods Sold (COGS). |
Understanding these pieces is the first step. The magic happens when you start connecting them to see the real story behind your numbers.
The True Cost of Inefficiency
Inefficiency isn't some abstract concept that lives on a spreadsheet. It creates real, cascading problems that ripple through your entire business. Small bottlenecks and redundant tasks might seem minor on their own, but they pile up fast, leading to some serious waste.
For instance, a marketing agency still clinging to manual timesheets might be losing 10-15% of its billable hours every month. Between inaccurate tracking and the administrative slog, that's a huge leak. For an agency billing $200,000 a month, we're talking about kissing up to $30,000 goodbye.
Sound familiar? Here are a few common scenarios where inefficiency rears its ugly head:
- Wasted Labor: A senior developer spends hours every week on admin tasks an automated tool could knock out in minutes. Project costs balloon as a result.
- Delayed Revenue: Shoddy resource planning pushes project timelines back again and again, delaying invoices and strangling cash flow.
- Reduced Quality: Teams are so busy rushing to meet deadlines caused by bad workflows that they're more likely to make mistakes, leading to painful rework and unhappy clients.
- Employee Burnout: Nobody enjoys constantly fighting fires or navigating broken processes. It's flat-out exhausting. Microsoft reports that over 40% of workers are thinking about quitting, with burnout being a huge driver.
Operational efficiency is not about making people work harder; it's about creating systems that allow them to work smarter. By eliminating friction, you unlock your team's true potential to innovate and deliver exceptional value.
From Firefighting to Strategic Growth
When companies get this right, they empower their teams to stop wrestling with chaos and start focusing on high-impact work. They can finally answer those big business questions with confidence: "Are we pricing our services correctly?" or "Can we actually handle that massive new client?"
This kind of clarity turns your operations from a reactive, firefighting mess into a proactive engine for growth.
Getting a grip on how to measure operational efficiency is the starting point. To truly capitalize on it, you’ll want to explore practical strategies to boost productivity at work that help you turn those insights into action. That's how you build a sustainable foundation for long-term success, no matter what the market throws at you.
Gathering the Right Data for an Accurate Picture
You can't improve what you don't measure. That old saying is the absolute truth when it comes to operational efficiency. To get a real handle on how your business is performing, you have to move past guesswork and start systematically capturing the information that actually matters.
The quality of the insights you get is a direct reflection of the quality of your data. Think of it this way: building a solid data collection process isn't just a preliminary step—it's the very foundation of your entire efficiency strategy.
This whole process boils down to tracking your inputs (what you spend) and your outputs (what you create).
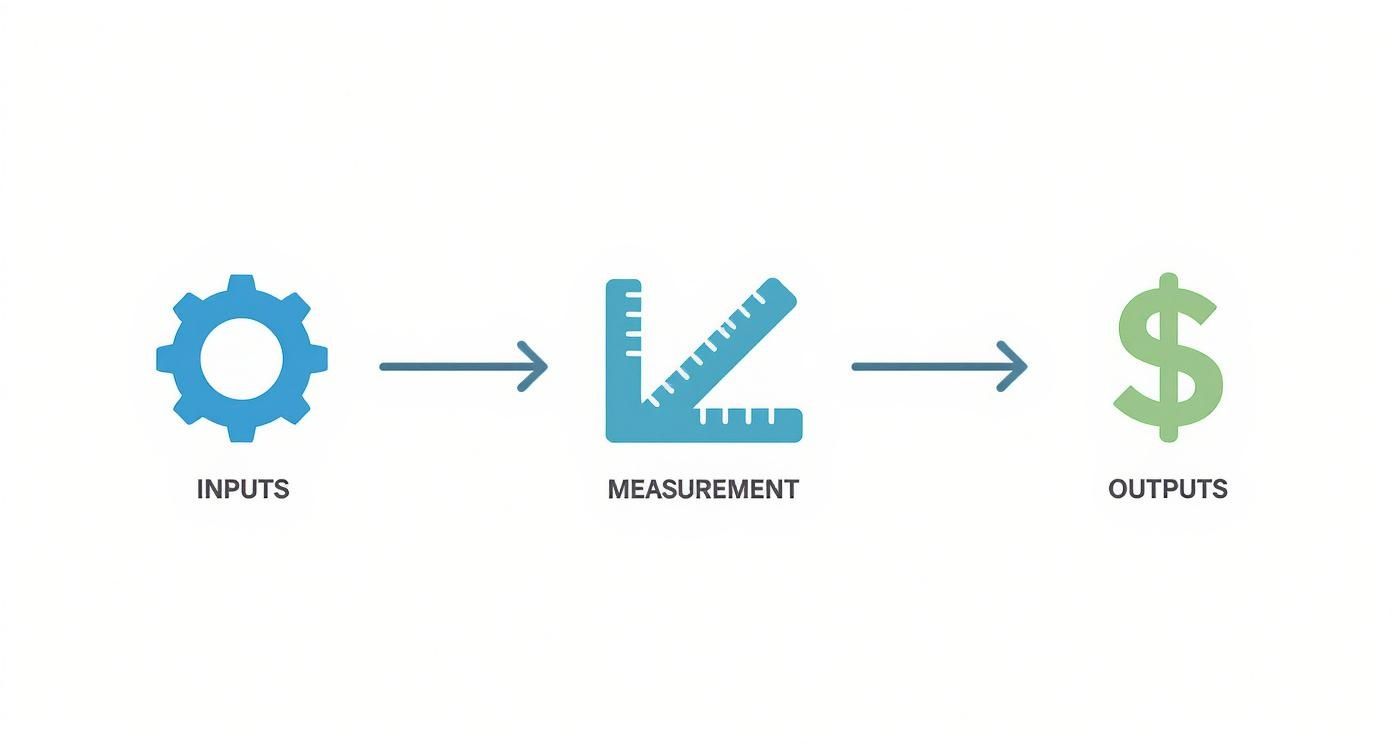
As you can see, inputs like your team's time and your money get converted into outputs through your daily operations. Those outputs are what ultimately drive revenue and create value.
Identifying Key Data Inputs
So, what are your inputs? They're simply all the resources you pour into getting work done. Tracking these accurately is non-negotiable if you want a clear picture of your costs.
Start by listing out your biggest resource drains. For most businesses, these will look familiar:
- Employee Time: This is the big one, especially for service-based companies. It's also the one most businesses track poorly. We're not just talking about total hours logged, but the time spent on specific clients, projects, or even internal meetings.
- Direct Project Costs: Think of all the tangible expenses tied to a project—software subscriptions, payments to freelancers, or any specialized materials you had to buy.
- Overhead Expenses: These are the general costs of keeping the lights on. Rent, utilities, administrative salaries—all of it needs to be accounted for and allocated properly.
When it comes to tracking employee time, automated tools like TimeTackle are a lifesaver. Instead of relying on manual timesheets (which are almost always inaccurate), it can sync directly with employee calendars to log activities automatically. This gives you a painfully honest, granular view of where your most expensive resource—your team’s time—is really going.
Capturing Meaningful Outputs
Your outputs are the value you generate. Without clear data on what you're producing, you have no way of knowing if your inputs are being spent effectively.
Here are the key outputs you should be tracking:
- Project Deliverables: The raw number of completed projects, features shipped, or marketing campaigns delivered.
- Revenue Generated: You'll want to break this down by project, client, or service line to pinpoint what's actually making you money.
- Client Satisfaction Scores: Metrics like Net Promoter Score (NPS) give you crucial qualitative data that links your operational efficiency directly to customer loyalty.
The good news is, you're probably already collecting this information somewhere. Your CRM is a goldmine for sales outputs and client data, while your accounting software has all the details on revenue and profitability. The real trick is pulling it all together.
Creating a Holistic View by Integrating Systems
One of the biggest roadblocks I see companies hit is data fragmentation. Their information is scattered across a dozen different apps that don't talk to each other.
According to Eptura’s 2025 Workplace Index Report, half of all businesses use an average of 17 disconnected worktech solutions, and a tiny 4% have platforms that are fully integrated. This chaos has a real cost: 37% of organizations need 11 or more full-time employees just to pull together operational data for reporting.
The core challenge isn't a lack of data; it's the overwhelming effort required to connect disparate data points into a single, coherent narrative about your business performance.
To get ahead of this, it helps to take a structured approach. Using an operational due diligence checklist can help you systematically gather data and spot gaps in your collection process before they mess up your analysis.
For a more hands-on way to get your resource data in order, our guide on creating a capacity planning template in Excel is a great starting point for structuring your input info. By bringing these different data streams together, you can finally build that accurate, holistic picture of your company's operational health.
The Key Metrics and Formulas You Actually Need
Alright, let's get down to the brass tacks—the actual calculations that will help you measure operational efficiency. Theory is great, but these formulas are what turn vague ideas into hard numbers you can track and improve. Think of this as your go-to toolkit for making sense of it all.
Each metric tells a different part of your business’s story. Some zero in on how well your team's time is being used, while others give you a bird's-eye view of financial health or the speed of your processes. When you combine them, you get a much clearer, multi-dimensional picture of how your operations are really performing.
Let's dive into the essential formulas that give the most bang for your buck, especially for service-based businesses like agencies, consultancies, and IT firms.
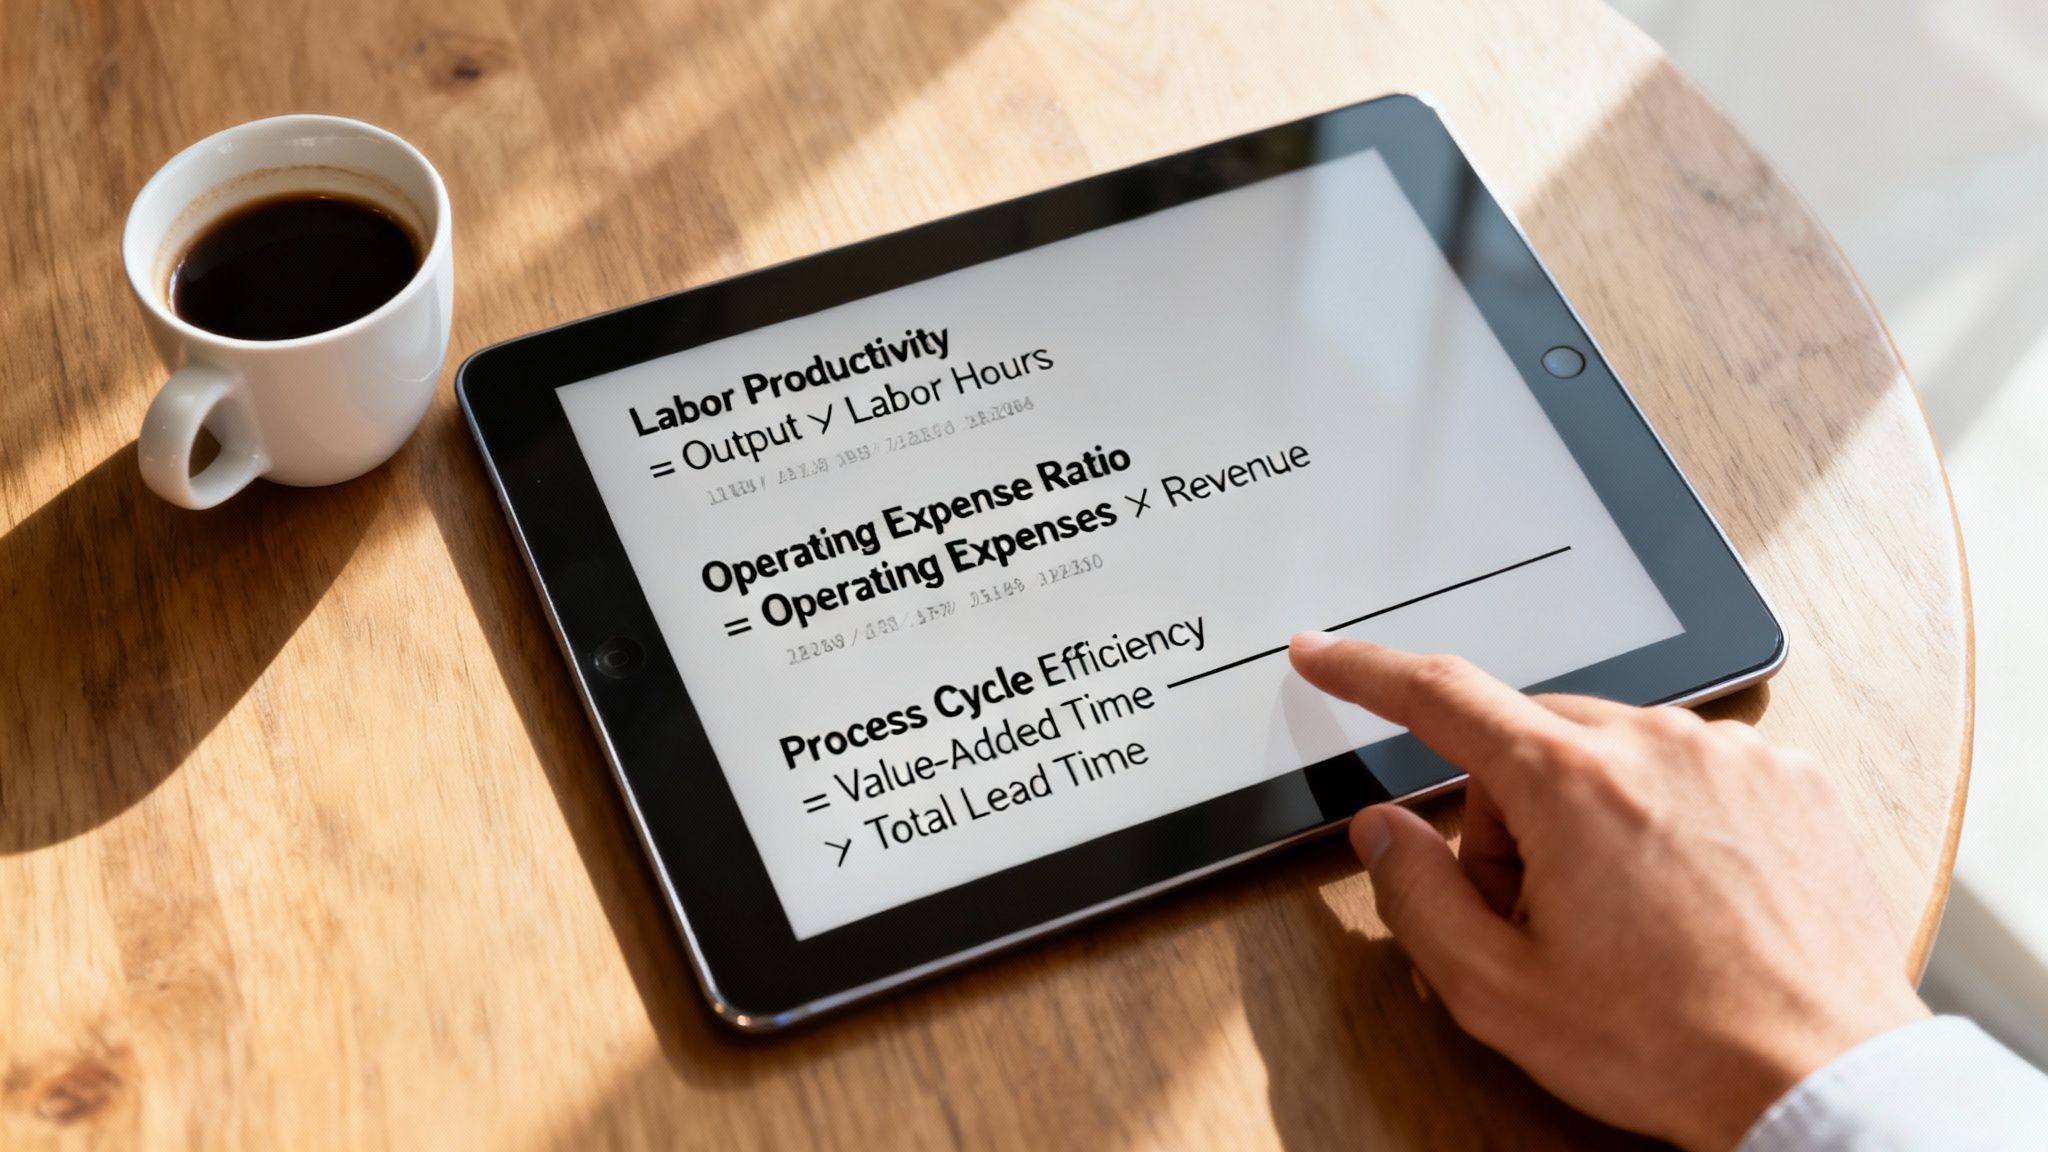
Labor Productivity
This is one of the most direct ways to see how well your team turns their time into real output. It answers the big question: "How much value are we actually generating for every hour we pay for?" For any business where payroll is the biggest line item, this is a non-negotiable metric.
The formula is pretty simple:
Labor Productivity = Total Output / Total Input (Labor Hours)
- Total Output can be things like units produced, projects completed, or—most commonly—the revenue generated.
- Total Input is just the total number of hours your team worked to achieve that output.
Say your marketing agency brought in $100,000 in revenue last month, and the team logged a combined 2,000 hours. Their labor productivity would be $100,000 / 2,000 hours = $50 per hour. This simple number gives you a baseline. If you see it start to dip over the next few months, that's a red flag that something is getting in your team's way.
Operating Expense Ratio
While labor productivity is all about your team, the Operating Expense Ratio (OER) zooms out to look at your company's overall financial efficiency. It shows you how much it costs to keep the lights on relative to the revenue you're bringing in. A lower ratio is almost always better, as it means more of your revenue is hitting the bottom line as profit.
Here’s how to calculate it:
Operating Expense Ratio = (Operating Expenses – Cost of Goods Sold) / Revenue
Imagine your consulting firm has $40,000 in monthly operating expenses—think rent, software subscriptions, salaries—and generates $150,000 in revenue. Your OER would be $40,000 / $150,000 = 0.267, or 26.7%. In other words, for every dollar that comes in, about 27 cents goes right back out to run the business.
This metric is incredibly useful for comparing your performance against industry benchmarks or your own past performance. A sudden spike in your OER could mean your overhead is growing faster than your revenue, telling you it's time to take a hard look at your spending.
Process Cycle Efficiency
This metric is a total game-changer for spotting just how much "waste" is lurking in your workflows. Process Cycle Efficiency (PCE) measures the amount of time spent on value-adding activities compared to the total time a project is in the pipeline. It’s brilliant at highlighting the true cost of delays, waiting periods, and busywork.
Here's the formula:
Process Cycle Efficiency = Value-Added Time / Total Lead Time
- Value-Added Time is the time spent on work the client actually pays for (e.g., coding, designing, writing copy).
- Total Lead Time is the full duration from project kickoff to final delivery, including every delay and approval bottleneck.
Let's say a design team bills for 120 hours of direct design work on a project. But, from the initial brief to final handoff, the project took 200 hours to get through the system—that includes all the time spent waiting for feedback, internal approvals, and other hold-ups.
Their Process Cycle Efficiency is 120 / 200 = 0.60, or 60%. This is a huge insight: a staggering 40% of the project's entire lifecycle was spent on non-value-adding activities. Just think about the opportunity there—slashing that 40% is a direct path to higher profitability and happier clients.
Tracking your value-added time often goes hand-in-hand with measuring resource utilization. While PCE reveals how efficient your process is, utilization shows how much of your team's available time is being put to productive use. To get the full picture, you really need to understand how to calculate utilization rate and see how these two metrics work together.
These three metrics—Labor Productivity, Operating Expense Ratio, and Process Cycle Efficiency—give you a powerful, balanced scorecard. They cover your people, your money, and your processes, giving you the complete data you need to make smarter, more strategic decisions.
Essential Operational Efficiency Formulas at a Glance
To make things even easier, here’s a quick-reference table with the key formulas we've just covered. Keep this handy as you start implementing your measurement strategy.
| Metric | Formula | What It Measures |
|---|---|---|
| Labor Productivity | Total Output / Total Input (Labor Hours) | The value generated for every hour of work your team puts in. |
| Operating Expense Ratio | (Operating Expenses – COGS) / Revenue | How much of your revenue is consumed by the costs of running the business. |
| Process Cycle Efficiency | Value-Added Time / Total Lead Time | The percentage of time spent on value-adding work versus total project time. |
By tracking these three metrics consistently, you’ll be well on your way to building a more efficient, profitable, and resilient operation. They provide the foundation for identifying weaknesses and capitalizing on your strengths.
Putting Technology to Work for You
Let's be honest, modern efficiency is all about working smarter, and technology is your best friend in that department. While the metrics and formulas we've discussed give you a snapshot of performance, technology is the engine that continuously measures, analyzes, and improves everything without drowning your team in manual data entry.
The old way of measuring operational efficiency was a painful grind of manual tracking. Think timesheets, endless spreadsheet exports, and hours spent trying to stitch together a coherent story from messy, fragmented data. That whole process isn't just slow and frustrating; it’s practically begging for human error.

Today, automation can completely change the game. Instead of someone manually logging every single minute, smart systems can automatically capture activity, assign time to the right projects, and serve up real-time insights on interactive dashboards. This isn't just about making data collection easier—it's about making it accurate and immediate.
Automating Your Input Tracking
For most service-based businesses, the single biggest input is employee time. It's also notoriously difficult to track accurately. This is exactly where automation delivers its biggest and fastest win.
Tools like TimeTackle hook directly into your team’s existing calendars (like Google or Outlook) to log activities automatically. Nobody has to fill out a timesheet. Ever. This approach gives you a few massive advantages right off the bat:
- Drastically Reduced Human Error: It gets rid of all the guesswork and "rounding up" that happens with manual time tracking, giving you a crystal-clear view of where every minute actually goes.
- More Granular Data: You can see time spent not just on a project, but on the specific meetings, tasks, and client calls tied to that project.
- Frees Up Your Team: Your most valuable people can stop wasting their day on administrative busywork and focus on the high-impact, billable work they were actually hired to do.
By automating this one crucial piece of data, you build your entire efficiency system on a foundation of truth. This has a huge ripple effect. Companies that make this switch often report a 30–40% drop in hours spent on manual data entry. That doesn't just free up people for more strategic work; it can also slash human error rates by as much as 50%.
Gaining Real-Time Insights with Dashboards
Once your data is flowing in automatically, the next move is to make it useful. This is where a dynamic dashboard becomes your command center. Instead of waiting for a month-end report, you get a live, visual pulse on your key efficiency metrics at any moment.
The real power of a dashboard isn't just seeing the numbers; it's the ability to ask questions and get immediate answers. It turns data from a static report into an interactive tool for decision-making.
With a well-designed dashboard, you can instantly see:
- Labor Productivity Trends: Is our revenue per hour trending up or down?
- Resource Utilization: Which teams are slammed, and who has the bandwidth to jump on a new project?
- Project Profitability: Are certain types of projects consistently making us more money than others?
This kind of real-time visibility lets you be proactive instead of reactive. You can spot a project going over budget long before it becomes a five-alarm fire or identify an underutilized team member and get them on a critical task. For some great ideas on how you can visualize your data, check out these different performance dashboard examples.
Scaling Without the Chaos
Ultimately, the whole point of measuring operational efficiency is to set yourself up for sustainable growth. Technology is what makes that possible. When you automate data collection and reporting, you create systems that can scale right alongside your business.
As you bring on more clients and more projects, you don't have to hire more people just to manage the administrative load. Your automated workflows can handle the increased data volume without breaking a sweat. This means you can grow your revenue and your team without the explosion of operational chaos that so often holds businesses back. The right tech stack doesn't just help you measure efficiency—it becomes a core part of your efficient operation itself.
Turning Your Efficiency Numbers Into Action
So, you've got your efficiency numbers. Great. But having the data is just the starting line—the real race is won by turning those numbers into smart, strategic changes. Your metrics are telling a story about your business, and learning to read that story is what separates tracking from true improvement.
What does it really mean when your labor productivity dips? Is it a sign your team needs more training? Is a new workflow creating an unseen bottleneck? Or was it just a bad month? This is where analysis meets action.
Identifying the Root Causes of Inefficiency
Think of your data points as symptoms, not the actual diagnosis. A low Process Cycle Efficiency score tells you there's waste, but it doesn't pinpoint where. The first step is to put on your detective hat and find the root cause.
Here are a few practical ways I've seen teams do this successfully:
- Process Mapping: This is more than just a flowchart; it's a powerful team exercise. Get everyone in a room (virtual or physical) and draw out a workflow from the very first step to the last. You’ll be shocked at how quickly you spot redundant approvals, awkward handoffs, and other delays that a spreadsheet could never show you.
- The "Five Whys" Technique: It sounds simple, but it works. When you hit a problem, just keep asking "Why?" until you get to the core issue. For instance: "The project was delayed." Why? "We missed the design deadline." Why? "The designer was waiting on client feedback." Why? "The client never got the mockups." Why? "They were sent to the wrong email." Why? "Our CRM contact list is outdated." And there it is. You've uncovered a data management problem, not a design problem.
- Gemba Walks: This is a concept borrowed from lean manufacturing that just means "go to the actual place where work happens." For a digital business, this could be sitting in on a project kickoff or watching how a team actually uses a specific software. It gives you invaluable context that numbers alone will never capture.
The point here isn't to assign blame. It's to uncover the systemic friction that prevents good people from doing great work. Once you see the real bottlenecks, the solutions become much clearer.
Developing Actionable Strategies for Improvement
After you've pinpointed the real problems, you can start crafting targeted solutions. Forget generic advice—your actions need to be a direct response to what your data is telling you.
If your metrics point to wasted time, it might be time to adopt some lean principles, which are all about systematically cutting out waste. I saw a marketing agency do this brilliantly. They realized they were spending dozens of hours a month on detailed proposals for unqualified leads. Their fix? A simple, two-stage qualification process that filtered out bad-fit clients early on, saving them a massive amount of time.
If you’re seeing frequent mistakes and rework dragging down your numbers, the answer is often targeted training. Maybe your junior developers are struggling with a new framework, causing delays for the whole team. Instead of just pushing through, investing in a specialized training course for them is a high-leverage move that solves the problem at its source.
The Critical Link Between Engagement and Efficiency
Finally, you can't talk about operational efficiency without talking about the people. No amount of process mapping or automation will fix a disengaged, burnt-out team. In fact, inefficient processes are often a direct cause of frustration and demoralization, which just fuels the fire of low productivity.
This isn't just a feeling; the numbers back it up. Only 21% of workers worldwide reported being engaged at work in 2024. That lack of engagement, which Gallup estimates led to $438 billion in lost productivity, is a massive drain on efficiency. When your numbers are suffering, it’s often a clear signal that your team’s morale is suffering, too. You can find more insights on the hidden costs of disengagement at archieapp.co.
Ultimately, this whole process is a continuous loop. You measure, you analyze, you act, and then you measure again to see if your changes actually worked. It’s an ongoing cycle of refinement that helps your business become more proactive, intelligent, and efficient.
Common Questions About Measuring Efficiency
Once you start trying to put these ideas into practice, you'll inevitably run into a few questions. Moving from theory to the real world is where things get interesting, and it's totally normal to hit a few snags along the way. Here are some straightforward answers to the questions we hear most often.
What Is a Good Operational Efficiency Ratio?
This is the million-dollar question, and the honest-to-goodness answer is: it depends entirely on your industry. You just can't compare a software company with almost no overhead to a manufacturing plant with massive material costs. Their benchmarks will be worlds apart.
Instead of getting hung up on a single "magic number," focus on these two things:
- Industry Benchmarks: Do a little digging to see what typical operating expense ratios look like for businesses similar to yours in size and sector. Financial analytics firms and industry associations are great places to find this data.
- Internal Trends: Honestly, your most important benchmark is your own past performance. The real goal here is consistent, steady improvement. Seeing that ratio drop, even by a small amount, month after month? That's a huge win.
The objective isn't to hit some arbitrary number you found online. It's to build a positive trend. Continuous improvement, even in tiny steps, is what a truly efficient operation looks like.
How Often Should I Measure Efficiency?
The right rhythm for measuring efficiency really depends on the metric and your business cycle. You don't need to track everything every single day—that's a quick way to get buried in data. A more balanced approach keeps you informed without causing analysis paralysis.
Here’s a practical schedule that works for most businesses:
- Weekly: This is the time for tactical metrics. Think team utilization and billable hours. Tracking these weekly lets you make quick tweaks to how you're allocating resources and stops small problems from turning into big ones.
- Monthly: Zoom out a bit and look at your financial metrics, like the Operating Expense Ratio and project profitability. This cadence gives you a clear snapshot of your financial health and helps you start spotting trends.
- Quarterly: Now it's time for the big picture. Analyze longer-term metrics like Process Cycle Efficiency and customer satisfaction scores. This is the perfect interval for a strategic review to find deeper issues or celebrate major successes.
How Does This Apply to a Service Business?
Measuring efficiency in a service business isn't just important—it's often more critical than in a product-based one. Why? Because your main "input" is your team's time and expertise, which is both your most valuable and most limited resource. The trick is to simply adapt the metrics to a non-manufacturing world.
For instance, a marketing agency wouldn't track "units produced." Instead, their output might be "campaigns launched" or "client projects completed." The fundamental idea is identical: you're still measuring your inputs (like employee hours and software costs) against your outputs (revenue and completed work). Metrics like Labor Productivity and Process Cycle Efficiency are especially powerful for any service-based company.
What Are the Biggest Mistakes to Avoid?
Sometimes, knowing what not to do is half the battle. As you get the hang of measuring operational efficiency, try to steer clear of these common traps:
- Fixating on a Single Metric: Don't get so obsessed with one number that you lose sight of everything else. A fantastic efficiency score means nothing if your customers are unhappy and your team is burning out.
- Ignoring Qualitative Data: Numbers tell you the "what," but they rarely tell you the "why." You absolutely have to talk to your team. They’re the ones on the ground who can explain the friction and frustrations that a spreadsheet will never show you.
- Forgetting the Real Goal: Remember why you're doing this. The point isn't just to be "efficient" for the sake of it. The goal is to build a stronger, more profitable business that's also a better and more sustainable place to work.
Ready to stop guessing where your team's time is going? TimeTackle automates your data collection and delivers the clear, real-time insights you need to make smarter operational decisions. Start your free trial today and turn your efficiency numbers into your competitive advantage. Learn more at https://www.timetackle.com.