For too long, the conversation around the productivity of teams has been stuck in the past, focusing on hours clocked instead of outcomes delivered. But let's be real: true productivity isn't about being busy. It’s about the value you create compared to the resources you put in.
Without a clear picture of how your team actually spends its time, any effort to improve that ratio is just a shot in the dark.
What team productivity actually means

If you're running an agency or a consulting firm, productivity is the engine of your business. It's directly tied to your profitability and your clients' success. We're not talking about logging more hours; we're talking about making every single hour count toward a meaningful goal.
This is the mindset shift that separates the teams that thrive from the ones just spinning their wheels.
The old way of doing things—relying on self-reported timesheets—is broken. They’re a pain for your team to fill out and are notoriously inaccurate. Modern teams need a better approach, one that measures the real effort behind the work. Only then can you connect that effort to tangible results like project profitability or happy, long-term clients.
This is exactly where automated data collection comes in. By pulling activity directly from the calendars and CRMs your team already lives in, you get an honest, real-time picture of where your most valuable resource—your team's time—is going.
The four pillars of modern team productivity
To really nail this, you have to think about productivity as a combination of a few core ideas. It's not just one thing, but a mix of efficiency, focus, alignment, and impact.
| Pillar | What It Measures | Why It Matters for Agencies |
|---|---|---|
| Efficient Processes | The time and effort it takes to move work from start to finish. | It uncovers bottlenecks that drain project profitability and cause delays. |
| Outcome-Focused Work | The value created for clients, not just the number of tasks completed. | It makes sure your team is working on what clients actually pay for, not just busywork. |
| Strategic Alignment | How well daily activities connect to larger business objectives and client goals. | It stops teams from wasting time on low-impact tasks that don't drive growth. |
| Data-Driven Decisions | Using accurate activity data to inform resource planning and project scoping. | It replaces guesswork with facts, leading to better estimates and healthier margins. |
Thinking in terms of these four pillars helps you move beyond just "being busy" and start building a truly effective operation.
Moving beyond "hustle culture"
Just pushing your team for more output without a smart strategy is a fast track to burnout, not better results. Real productivity is sustainable. It's also about knowing what not to do, like prioritizing endless tasks at the expense of your team's well-being. Leaders need to be aware of the dangers here, which is why breaking free from toxic productivity is so important for building a healthier, more effective work environment.
A truly productive team isn't the one working the longest hours. It's the one that hits its goals efficiently, again and again.
By reframing productivity around valuable outcomes, you stop managing time and start managing results. This empowers your team to focus on what they do best, knowing their effort is directed where it matters most.
Team productivity isn't just an operational metric. It’s a strategic one. Think of it as a vital sign for your organization's health, efficiency, and growth potential. Without that clarity, you're flying blind.
The four metrics that actually matter
When you stop measuring "busyness" and start focusing on actual value, your whole perspective changes. You need a new scoreboard. Forget relying on a gut feeling about whether the team is working hard.
To really get a handle on the productivity of teams, you have to track the numbers that count. These four metrics give you a clear, well-rounded picture of your team’s performance, looking past the hours logged to see the results they’re actually creating.
Utilization rate: the gas in your tank
Think of your team's total available work hours as a full tank of gas. The utilization rate is just the percentage of that fuel being used to drive forward—on billable client work or core project tasks.
A low utilization rate might signal that a team member is getting swamped with admin work, or maybe there just isn't enough billable work to fill their plate. But watch out for the other extreme. A rate that’s constantly near 95% is a massive red flag for burnout. It means there's no time left for learning, internal projects, or even just catching a breath.
For a creative agency, this is huge for resource planning. If you see your best designer is only 60% utilized on client projects, you can start asking why. Maybe you’ll discover that the other 40% is being eaten up by endless internal meetings—a problem you can now see, measure, and fix.
Throughput: the number of cars off the line
Picture your team as a factory assembly line. Throughput is simply the number of finished cars that roll out the door in a set period, like a week or a month. In your world, that translates to the number of tasks, tickets, or project milestones they complete.
This metric is all about understanding your team's real capacity. It’s not about how fast people are moving, but about how much finished work they produce. If your team's throughput suddenly tanks, it's a clear signal that something is getting in their way.
It could be anything from a confusing new process to a string of technical roadblocks. Tracking this number over time helps you spot these trends early and solve the root problem before it completely derails a project.
Throughput gives you a simple, high-level look at your team's output. It doesn't tell the whole story by itself, but a steady or rising throughput is one of the strongest signs you have a healthy, functioning team.
Cycle time: how long each car takes to build
Let's stick with our factory analogy. If throughput is how many cars you make, Cycle Time is how long it takes to build a single car, from the moment you start to the moment it’s finished. For your team, it’s the time that passes from when work begins on a task until it's marked "done."
This is probably one of the most powerful metrics you can track for diagnosing problems with the productivity of teams. A long cycle time almost always points straight to a bottleneck in your workflow.
Imagine your agency’s design process has a cycle time of ten days for a simple web banner. When you dig into the data, you might find that the task sits in the "awaiting client review" stage for an average of seven of those days. The problem isn't your designers; it's the feedback loop. Armed with that data, you can build a better review process and maybe cut your cycle time in half.
Project ROI: the profit from every car sold
Finally, we have Project ROI (Return on Investment). This is where you connect all of your team’s effort directly back to business value. It boils down to a simple question: did this project make more money than it cost to complete?
To figure this out, you absolutely need accurate data on the hours your team invested. This is where automated time capture is a game-changer. When you know a project took 500 hours of team time at an average cost of $100/hour, your investment is $50,000. If that project generated $80,000 in revenue, the ROI is crystal clear.
This single metric helps you answer some of the most important questions in your business:
- Which types of projects are actually profitable? You might find that short consulting gigs deliver a much better return than long, complex development projects.
- Are we scoping our work correctly? If projects constantly run over budget and shrink your margins, it’s a sign your initial estimates are way off.
- Which clients are true partners? Some clients might bring in a lot of revenue, but they demand so much time and effort that their ROI is practically zero.
By keeping an eye on these four metrics, you get a balanced view. You're no longer just measuring speed or busyness. You're measuring efficiency, capacity, and the one thing that matters most: the real value your team delivers.
Why manual timesheets are killing your team's output

If the metrics we've discussed are the vital signs of your team’s health, then manual timesheets are the bad habit that’s slowly making things worse. They introduce constant friction, sink morale, and are a huge reason why getting a straight answer on the productivity of teams feels like an impossible task.
We've all seen the classic end-of-week scramble. It’s 4 PM on a Friday, and the reminder emails start flying. Your best people have to stop doing valuable, billable work just to piece together their week from memory. What you get back is a jumble of guesstimates and forgotten tasks, rushed through just to check a box.
This isn't just a minor annoyance. It's a genuine productivity killer that quietly sabotages your business.
The hidden costs of the timesheet scramble
That weekly ritual seems small, but the damage adds up fast. The time spent on this purely administrative chore is time stolen directly from client projects and strategic work. If you have 50 team members who each spend just 30 minutes a week filling out timesheets, you're throwing away over 100 hours of productive time every single month.
But the real costs run much deeper than just lost hours:
- Inaccurate Project Costing: You can’t calculate project ROI or utilization with any real confidence when your data is based on fuzzy, week-old memories. Guesstimates lead to flawed financials.
- Delayed Invoicing: When timesheets are late or incomplete, you can't bill your clients on time. This creates an immediate drag on your cash flow and piles on extra work for your finance team.
- Lowered Morale: Let's be honest—nobody likes filling out timesheets. Forcing skilled professionals to spend their time on tedious admin is a surefire way to make them feel undervalued.
This administrative grind creates a culture where people just want to get it over with, breeding disengagement and turning a potentially useful tool into a chore everyone dreads.
The direct link between engagement and output
Timesheet fatigue isn't just an inconvenience; it actively disconnects your team from their work. This is a massive problem. Recent analysis found that in 2026, global employee engagement plummeted to just 21%. That staggering drop is estimated to have cost the world economy an unbelievable $438 billion in lost productivity.
The evidence is overwhelming: highly engaged teams are simply better for business. They deliver 23% higher profitability and a 14% bump in overall productivity. You can dig into more of these eye-opening employee productivity statistics on archieapp.co.
When your team is bogged down by manual tracking, their focus shifts from solving real problems to just getting the paperwork done. That's the exact opposite of what you need for high performance.
When you automate the tedious parts of the job, you free up your team's mental energy to focus on high-value work. This is the first and most important step toward boosting both engagement and output.
The solution isn’t to get better at chasing people down for their timesheets. The real fix is to get rid of the manual process for good.
Shifting from manual entry to automated capture
Picture a world with no Friday scramble. Instead of relying on guesswork, what if you could automatically build a complete, accurate record of your team’s activities straight from the tools they already live in every day?
That’s exactly what modern productivity platforms are designed to do. By integrating with calendars like Google or Outlook and plugging into your CRM, they create a real-time, accurate picture of where every single hour is going.
- A client call is automatically logged from the calendar event.
- Time spent on a sales opportunity is pulled directly from the CRM.
- Internal meetings are categorized and recorded without anyone lifting a finger.
This completely changes the game. Time tracking is no longer a backward-looking chore; it becomes a forward-looking strategic asset. You eliminate the friction, drastically improve data accuracy, and give your talented people their most valuable resource back: their time. Suddenly, you have a clear, honest view of your team's efforts—the essential foundation for making smart decisions that improve the productivity of teams across the board.
How to automate data collection for a clearer picture
Let's be honest: the problem with manual timesheets isn't your people, it's the process itself. Asking your team to stop doing valuable work just to remember how they spent the last few hours is inefficient and, frankly, a recipe for inaccurate data.
If you want a truly clear picture of your team’s productivity, you have to stop asking them to create data and start capturing it automatically where it already lives.
Modern platforms do this by connecting directly to the tools your team already uses every single day. Think of it as building a complete, passive record of all team activities, without anyone having to lift a finger.
Connecting the dots with calendars and CRMs
The real magic here is integration. By syncing with tools like Google Calendar, Outlook, and your company’s CRM, you can build a rich, contextual log of where every single minute is going.
This isn’t about playing Big Brother. It’s about getting the story straight. When you connect these data sources, you see how time is actually spent, not how it's remembered.
- Client Meetings: Every call on the calendar is automatically logged and tied to the right client or project.
- Sales Activities: Time spent on discovery calls or writing proposals can be pulled directly from your CRM and linked to a specific opportunity.
- Internal Work: Team huddles, one-on-ones, and strategy sessions are all captured, giving you a clear, honest look at your operational overhead.
This approach transforms data collection from a nagging chore into a silent, background process. You get a real-time dashboard of team activity, which is a massive leap forward from a spreadsheet that’s already obsolete the moment it’s submitted.
From raw data to actionable insights
Just collecting data isn't the endgame; you have to make sense of it. This is where you can lean on automation rules to do the heavy lifting. You can set up workflows to automatically tag and categorize activities based on keywords, attendees, or the associated CRM record.
For instance, any calendar event with "Project Phoenix" in the title can be instantly tagged to that project. Any meeting that includes a specific client can be marked as billable work. This simple step enriches your data without a single manual keystroke, turning a chaotic stream of activities into a structured, analyzable dataset.
This kind of dashboard lets you visualize time spent across different clients and projects, giving you an at-a-glance view of where your resources are really going.
With this level of detail, you can immediately spot where your team’s effort is concentrated and make sure it lines up with your strategic priorities.
The goal is to create a system where accurate time tracking happens as a byproduct of normal work, not as an extra task. This frees up your team to focus on what they do best: delivering value.
Tapping into AI for smarter productivity
This automated approach gets even smarter when you add AI into the mix. AI is already reshaping how teams operate, with employees using generative AI saving an average of 5.4% of their work hours. As adoption climbs—it's projected to be used by 40% of US employees by 2026—companies that embrace AI-driven processes are seeing 2.5x higher revenue growth.
This is especially true when you consider that the average employee is only productive for about 60% of their day. You can dig into more data on how AI is impacting employee productivity on worktime.com.
For managers and COOs, this translates into having a SOC 2-secure, real-time dashboard that clearly shows project ROI and team efficiency. With this kind of clarity, you can finally move beyond guesswork and start making confident decisions about resource allocation, project health, and overall team performance. To see how this works in practice, you can learn more about how automated timesheets can change the way you manage time.
Turning productivity insights into real improvements
Collecting accurate data is just the first step. The real value comes when you use those numbers to make smarter decisions that actually improve the productivity of teams. An analytics dashboard full of charts is useless if it doesn't lead to meaningful action.
The goal here is to build a simple, repeatable workflow. You want to move from observation to diagnosis, and then from diagnosis to a concrete improvement plan. This is how you turn raw data from a simple report into a powerful tool for strategic change.
This visual breaks down the three-step process for turning raw activity into clear business insights.
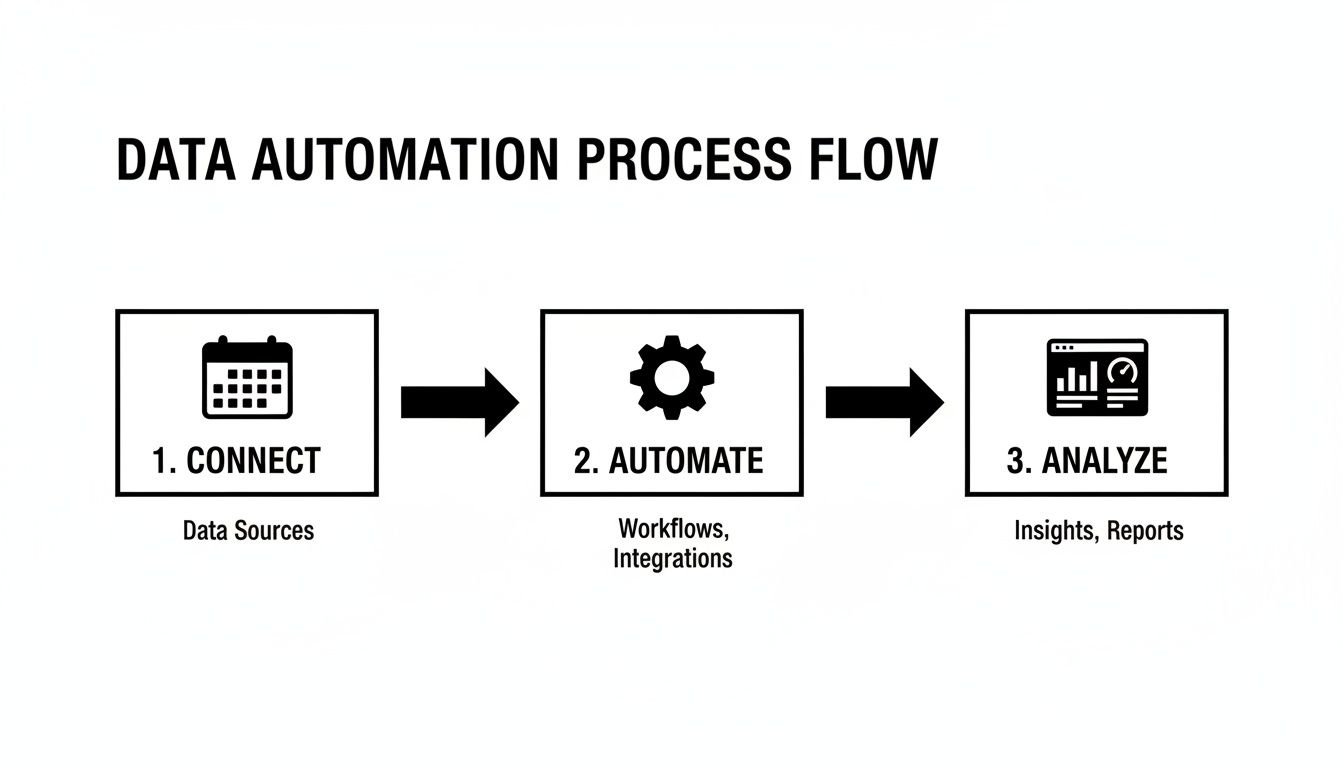
By connecting your tools, automating how work gets categorized, and analyzing the results, you create a continuous feedback loop that fuels real improvement.
From diagnostics to actionable change
Once you have a clear picture of how everyone’s time is being spent, you can finally start asking the right questions. Your utilization dashboards suddenly become a diagnostic tool, helping you spot hidden problems before they derail projects or burn out your best people.
Think of it like a doctor reviewing a patient's chart. You’re not just looking at numbers; you’re looking for patterns and anomalies that tell a deeper story.
- Spotting Burnout Risks: Is a key team member consistently logging 90% utilization on billable work? That isn't a sign of a superstar; it’s a bright red warning sign for burnout. This data gives you the chance to step in, redistribute the workload, and protect your most valuable people.
- Finding Underused Resources: On the flip side, is a team or individual showing consistently low utilization? This could mean they don't have enough on their plate, or they’re stuck drowning in administrative overhead. Now you can dig in and reallocate their skills to higher-value projects where they can make a real impact.
- Fixing Your Workflows: Analyzing cycle times helps you pinpoint exactly where work gets stuck. If a task sits in "awaiting review" for days on end, you know you have a communication bottleneck, not a production problem. You can then redesign your review process to keep work flowing smoothly.
Presenting this kind of data effectively is a skill in itself. To learn more, you can explore the data visualization best practices in our guide.
Putting these ideas into motion is the final piece of the puzzle. For a deeper dive, you can discover a few smart strategies to improve workplace productivity that you can implement right away.
From insight to action: a diagnostic workflow
Seeing the data is one thing; knowing what to do with it is another. The table below offers a practical workflow for moving from a data-driven insight to a real, actionable solution. It helps you connect the "what" to the "why" and, most importantly, the "how."
| Insight (The 'What') | Potential Problem (The 'Why') | Actionable Next Step (The 'How') |
|---|---|---|
| An engineer's utilization is consistently over 90%. | High burnout risk; potential for mistakes. | Review their workload. Can tasks be delegated or timelines adjusted? |
| Cycle time for "Design Review" is 3x longer than other stages. | Process bottleneck; reviewers are overloaded or unavailable. | Schedule dedicated review blocks or assign a secondary reviewer. |
| Sales team spends 30% of their time on internal meetings. | Too much administrative overhead is pulling them from selling. | Audit recurring meetings. Can some be replaced with an email update? |
| Project ROI is low despite high team activity. | Effort isn't aligned with high-value tasks (scope creep). | Revisit project goals with the client and team to refocus efforts. |
This framework isn't just about solving problems after they appear. It's about building a proactive culture where data helps you anticipate challenges and optimize performance before a project ever goes off the rails.
A case study in action
Let’s look at a real-world example. A digital marketing agency was struggling with profitability on what should have been straightforward client projects. They felt like their pre-sales team was constantly slammed, but new business just wasn't closing at the rate it should have been.
By using calendar analytics, they made a shocking discovery. Their top pre-sales consultants were spending nearly 40% of their week on discovery calls with completely unqualified leads. These were prospects who were never going to be a good fit, and the team was burning hundreds of valuable hours on dead ends.
Armed with this data, they completely refined their sales process. They implemented a stricter qualification checklist for inbound leads and created new content to help prospects self-qualify before even booking a call.
The result? They cut time spent on unqualified leads by over 75% and freed up their experts to focus on opportunities that actually had a chance of closing. This simple change, driven entirely by accurate time data, directly boosted their sales efficiency and their bottom line.
Connecting team effort to business goals
This all comes back to a core idea: improving the productivity of teams isn't about making people work harder. It’s about making sure their hard work is aimed squarely at the right targets.
Teams that collaborate effectively don't just feel better—they perform better. Studies show they stay on tasks 64% longer, work 15% faster, and produce work that is 73% higher in quality. Yet, a staggering 86% of workers point to poor communication as a primary cause of workplace failures.
For agencies fighting timesheet fatigue, using calendar-integrated platforms to visualize team activity is a powerful way to foster better alignment without the manual grind. By connecting effort to outcomes, you give your team the purpose and clarity they need to do their best work. That, in the end, is the ultimate driver of sustainable productivity.
Your implementation checklist for better productivity
Diving into a new way of tracking team productivity can feel like a massive undertaking, but it doesn't have to be. Getting started is often much simpler than you think. The trick is to take it one step at a time, aiming for quick wins that build momentum and show your team the immediate value of a smarter approach.
This checklist will get you from zero to your first real insights in just five straightforward steps.
Step 1: Connect your tools
First things first, you need a foundation. This means linking the calendars and CRMs your team already lives in every day. This single action creates a passive, automatic stream of data that makes manual timesheets a thing of the past.
Think of it like plugging in your sensors. There's no new software for your team to learn and zero changes to their daily routine. The process is designed to be completely invisible, running quietly in the background to build an accurate picture of where time is actually going.
Step 2: Define your tags
Once your tools are connected, it's time to bring some order to the data. Set up the project names, client accounts, and internal categories that are meaningful to your business. These tags are what turn a simple list of meetings and tasks into a structured, analyzable dataset.
You can organize your tags by:
- Project Codes: Align these with your existing project management system so everything lines up perfectly.
- Client Names: Make sure all client-facing work is properly attributed from the start.
- Work Types: Differentiate between billable hours, internal strategy, sales activities, and administrative tasks.
- Team or Department: Segment data to see how different parts of the organization spend their time.
Step 3: Create automated rules
This is where you let the system do the heavy lifting. You can build simple, automated rules that categorize time based on keywords, meeting attendees, or an associated CRM record. This is what truly eliminates timesheet fatigue and ensures your data is consistent and reliable.
For instance, a rule could automatically tag any calendar event that contains "Project Alpha" or is attended by your client’s main point of contact. This simple workflow saves countless hours and removes human error, giving you clean data from day one.
With automated rules, your productivity data organizes itself. This frees up your team from administrative busywork and lets you focus on analyzing the results, not cleaning up the input.
Step 4: Analyze your baseline
Let the system run for just two weeks. That's all it takes to get your first major asset: a baseline. This initial dataset is your starting point, showing you exactly how your team's time is currently being spent.
Look over this early data to spot the first patterns. You might be surprised to see how much time is lost to internal meetings or which clients are soaking up the most resources. This baseline provides the crucial "before" picture you need to measure any future improvements against.
Step 5: Set improvement goals
With a clear baseline in hand, you can finally set realistic, measurable goals. Don't try to fix everything at once. Pick one or two key areas to focus on first, like improving your team's billable utilization by 10% or cutting down the cycle time on a key project deliverable.
Setting clear targets gives your team a direction and makes tracking progress easy. This is also how you connect your team's day-to-day efforts back to bigger business objectives, like improving project profitability. For more on this, our guide on what is capacity planning is a great resource for aligning your resources with your new goals.
Frequently asked questions
Switching from old-school timesheets to a smarter, data-driven way of working always brings up a few questions. Let's tackle some of the most common ones we hear from operations leaders and managers.
How do we measure productivity for creative work?
This is a great question because creative work isn't like a factory assembly line. For roles built on strategy and creativity, focusing purely on the quantity of output is a dead end.
The trick is to shift your focus from raw output to the impact and efficiency of the work. You can do this by looking at a few key indicators:
- Project ROI: How did the time spent on a project stack up against the revenue or value it created?
- Client Satisfaction: Use metrics like feedback scores or client retention to directly measure the quality of what your team delivers.
- Cycle Time: Track how long it takes for a creative idea to go from the initial brief to the final product.
This isn't about putting creatives on a stopwatch. It's about protecting their most valuable resource—deep, focused time—by making sure administrative drag isn't slowing them down.
Will my team feel like they're being watched?
We hear this concern a lot, and the answer comes down to one word: transparency. How you frame this change is everything.
Position automated time capture for what it really is: a tool to eliminate one of the most annoying, time-draining tasks out there—filling out a manual timesheet.
Explain that the goal isn't to monitor every single click. It's about understanding how work flows at a team and project level. This data helps you spot bottlenecks, protect focus time, and ensure workloads are balanced. When your team sees the data is being used to make their work lives better, not harder, that initial hesitation almost always disappears.
How long until we see meaningful results?
You'll start seeing useful data almost right away. Within the first two weeks of passively collecting activity data from calendars, you’ll get a solid baseline of where your team's time is truly going.
The deeper insights—the kind that drive real change, like spotting broken workflows or identifying resource gaps—typically surface within the first 30 to 60 days. The key is to not try and boil the ocean. Pick one specific problem to solve, like improving project profitability or reining in excessive meetings, and zero in on the metrics that matter for that goal.
Ready to stop chasing timesheets and start getting a clear, accurate picture of your team’s productivity? TimeTackle provides the automated insights you need to make smarter decisions, improve profitability, and give your team their focus back. See how it works at https://www.timetackle.com.