Running a creative or consulting agency without clear project metrics is like sailing a ship with no compass—you're moving, but you have no idea if you're on course, profitable, or heading for disaster. These numbers aren't just about tracking hours. They're your navigation system for profitability, turning guesswork into predictable success. This guide will show you how to shift from reactive firefighting to proactive, data-informed decision-making.
Why Your Agency Is Losing Money Without Project Metrics

Many mid-sized agencies operate on tight margins where even small inefficiencies can quickly eat away at profits. Without a clear view of project performance, money quietly leaks through untracked hours, scope creep, and clunky workflows. This isn't just a minor issue; it's a serious financial drain that puts your agency's long-term health at risk.
The problem is more widespread than you might think. Across industries, organizations lose about 11.4% of their investment in projects due to poor performance. That’s nearly 10 cents wasted for every dollar spent, often driven by misaligned goals and a lack of the right tools. For agencies where manual timesheets already chew up valuable hours, these losses are only amplified.
The Real Cost of Guesswork
When you don't track project metrics, every decision becomes a gamble. You might be underpricing your services, overstaffing projects, or letting small client requests balloon into major, unpaid work. These hidden costs pile up, turning what looked like a profitable engagement into a financial loss.
"The absence of metrics doesn't just obscure the path forward; it hides the financial quicksand you're already standing in. It fosters a culture of firefighting rather than strategic planning."
Effective project metrics in project management act as your agency’s financial early-warning system. They help you pinpoint exactly where value is created and where it's being lost. Understanding the link between project activities and their financial results is everything. Exploring how to connect business outcomes from delivery and cost provides a deeper look into this critical relationship.
With the right data, you can finally answer the questions that keep you up at night:
- Which clients or project types are actually our most profitable?
- Are our team members' skills being used effectively on billable work?
- How much is scope creep really costing us on each project?
Answering these questions is the first step toward plugging financial leaks and building a more resilient, profitable agency. For a solid starting point, check out our guide on how to properly track billable hours.
The Three Pillars of Actionable Project Metrics
When it comes to project metrics in project management, you don't need to track dozens of different data points. Drowning in data just leads to analysis paralysis, where you have plenty of information but no clear idea of what to do next. A much smarter approach is to focus on a few key areas that directly impact your agency's survival and growth.
Think of your project metrics system like a three-legged stool. If any one leg is weak or missing, the whole thing gets wobbly and unstable. These three essential legs—or pillars—are Financial Health, Operational Efficiency, and Client Success.
Pillar 1: Financial Health
This pillar cuts right to the chase and answers the most fundamental question for any business: “Is this project actually making us money?” Financial health metrics slice through the noise to show you the real profitability of your work. They’re how you figure out if your pricing is right, your budgets are realistic, and your projects are actually generating a positive return.
A classic metric here is Budget vs. Actual Cost. This is a straightforward, no-nonsense comparison of what you planned to spend versus what you’ve really spent.
- Formula:
Actual Cost - Budgeted Cost = Variance - Example: A creative agency budgets $20,000 for a website redesign. Halfway through, they check their tracked time and expenses and realize they’ve already burned through $15,000. That $5,000 negative variance is a huge red flag. It’s an early warning that the project is speeding toward a loss, forcing an immediate review of scope and how resources are being used.
Pillar 2: Operational Efficiency
Operational efficiency metrics are all about how well you’re using your most valuable, non-renewable asset: your team’s time. They give you a clear window into your agency’s productivity, capacity, and overall workflow. Are you getting the most out of every hour, or is precious time slipping through the cracks on non-billable tasks and internal friction?
The most critical metric in this pillar is Billable Utilization. This simply shows the percentage of an employee's total work hours that are spent on tasks that actually make the company money.
A healthy utilization rate is a great sign of a productive team. But be careful—a rate that’s too high (creeping up toward 100%) can be a major red flag for burnout, signaling that you either need to manage resources better or start hiring.
- Formula:
(Total Billable Hours / Total Available Hours) * 100 = Utilization Rate - Example: A designer on your team works a standard 40-hour week. If they log 32 hours on client projects, their billable utilization is 80%. For most service businesses, that’s a fantastic target. It means they’re highly productive while still having breathing room for important non-billable work like training, team meetings, and professional development.
Pillar 3: Client Success
At the end of the day, your agency only succeeds if it delivers real value to its clients. This pillar is all about metrics that measure client satisfaction and the health of the project from their point of view. It helps you answer the big questions: “Are we delivering what we promised?” and “Is the client happy with the results and the experience?”
A crucial metric for Client Success is Scope Creep. This tracks how much a project’s original requirements expand over time, usually through a series of small, "can you just…" requests that go un-billed.
- Formula:
((Current Total Hours - New Approved Scope Hours) - Original Project Hours) / Original Project Hours * 100 = Scope Creep % - Example: An agency scopes a project for 100 hours. Along the way, the client makes several “small” change requests that quietly add up to 25 extra hours of work, none of which were approved in a formal change order. The scope creep is now 25%. That's a huge problem, as it directly eats into the project’s profit margin and puts a major strain on your team. Tracking this gives you the hard data needed to have a constructive conversation about adjusting the budget or timeline.
To make this easier to digest, we’ve broken down these core metrics into a simple table. Think of this as your starting dashboard for a healthier, more profitable agency.
Essential Project Metrics for Service Agencies
A breakdown of crucial metrics across three core pillars, explaining what each measures and why it is vital for agency success.
| Pillar | Metric | What It Measures | Why It Matters for Your Agency |
|---|---|---|---|
| Financial Health | Budget vs. Actual | The variance between planned project costs and actual expenditures. | Instantly reveals if a project is on track to be profitable or is heading for a loss, enabling early intervention. |
| Financial Health | Profit Margin | The percentage of revenue that is actual profit after all costs are paid. | The ultimate indicator of financial success; helps you price projects correctly and identify your most lucrative services. |
| Operational Efficiency | Billable Utilization | The percentage of an employee’s time spent on revenue-generating work. | Shows how effectively your team's time is being converted into revenue and helps prevent both underutilization and burnout. |
| Operational Efficiency | Task Completion Rate | The ratio of tasks completed on time versus the total number of tasks. | A direct measure of your team’s ability to meet deadlines and highlights potential bottlenecks in your workflow. |
| Client Success | Scope Creep | The expansion of project requirements beyond the original agreement. | Protects profitability by quantifying unpaid work, giving you the data needed to manage client expectations and re-scope. |
| Client Success | Client Satisfaction (CSAT) | A direct measure of client happiness with the project outcome and process. | Happy clients lead to repeat business and referrals. This metric tells you if you're delivering on your promises. |
Sticking to these three pillars gives you a balanced and comprehensive view of your agency's performance. You're not just looking at money or just at operations—you're seeing the complete picture. This balanced approach is the key to making smarter decisions that lead to sustainable growth.
Choosing The Right Metrics for Your Agency Goals
Knowing which project metrics exist is one thing, but actually using them to drive real business outcomes? That’s a completely different ballgame. The secret is to stop tracking everything under the sun and start measuring what directly supports your agency's biggest goals. Forget the cluttered, overwhelming dashboards. The aim is to zero in on a select few metrics that answer your most urgent strategic questions.
This simple shift in mindset turns project metrics in project management from a boring reporting task into an active tool for growth. Of course, before you can pick the right metrics, it helps to have a handle on the kinds of work you're measuring. If you need a refresher, you can explore different types of projects to get a clearer picture of what you might need to track.
Map Metrics To Your Mission
The single most effective way to pick your key performance indicators (KPIs) is to work backward from your objective. Start by clearly defining the "job-to-be-done." What’s the number one problem you're trying to solve right now? Once you nail that down, the metrics you need to track progress will practically jump out at you.
Let’s walk through a couple of common scenarios for mid-sized agencies:
Goal: Increase Project Profitability
Are your projects consistently running over budget and squeezing your margins? If so, your focus needs to be laser-sharp on the financials. You need metrics that tell you exactly where you’re making money and where you’re losing it. In this case, your go-to KPIs would be Project Margin and Budget vs. Actual Cost. These numbers give you a brutally honest, real-time look at your financial health.Goal: Improve On-Time Delivery
Is your team always scrambling to meet deadlines? Are clients getting frustrated with delays? Then your focus should be on operational efficiency. You need metrics that shine a light on your workflow and how well you stick to timelines. Here, you’d want to prioritize Schedule Variance and On-Time Completion Rate to spot bottlenecks and tighten up your planning.
Choosing metrics is like packing for a trip. You don't bring your entire wardrobe; you bring what's essential for the destination. If your goal is profitability, pack your financial metrics. If it's delivery speed, pack your operational ones.
This graphic breaks down the simple, three-step process of connecting your agency's goals to the right metrics and, finally, to the right dashboard.
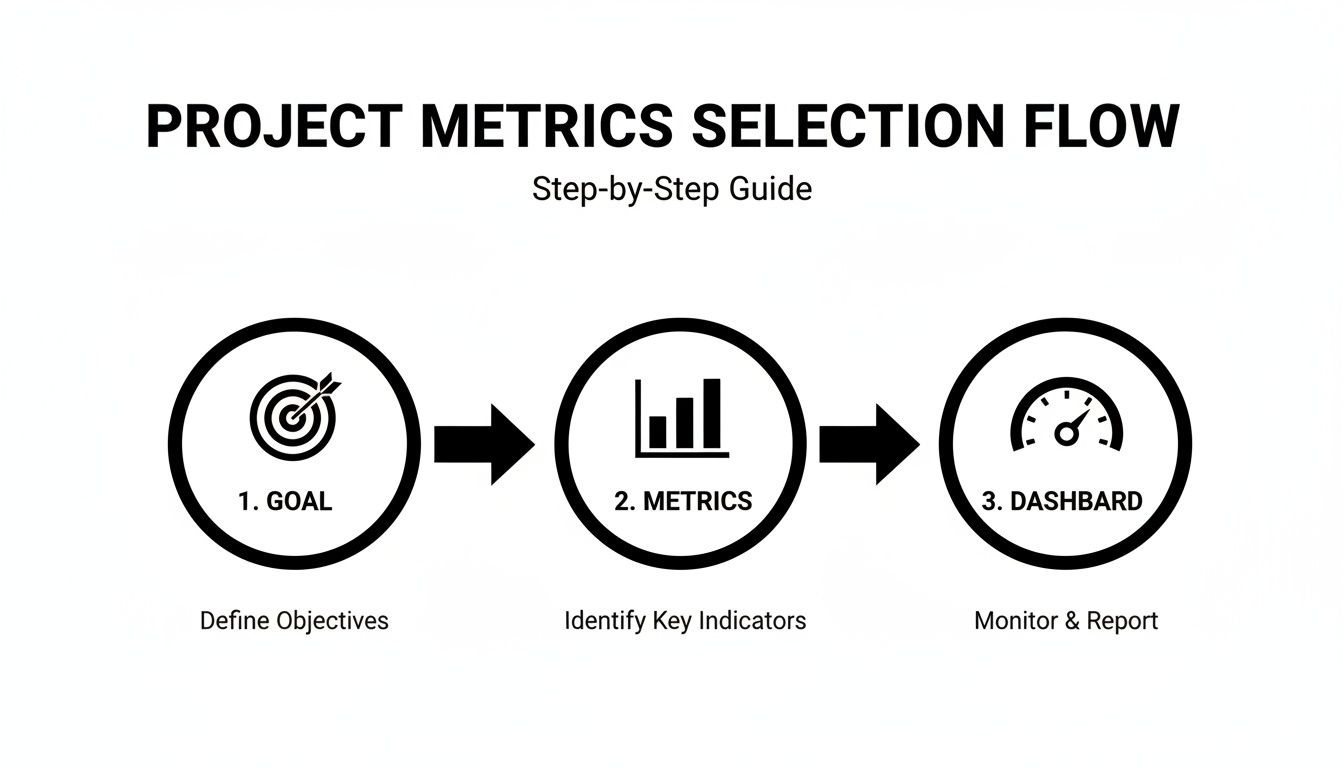
As the flow shows, successful measurement always starts with a clear goal. That goal dictates which metrics you track, which in turn dictates how you visualize them.
A Practical Example: Increasing Team Efficiency
Let's say your main priority is to boost team efficiency. You want to be absolutely sure you have the right people on the right tasks at the right time. The "job-to-be-done" here is all about optimizing how you allocate your resources.
For this specific goal, the most powerful metric you can track is Billable Utilization. It cuts right to the chase, measuring the percentage of your team's time that's spent on work that actually generates revenue.
Keeping an eye on this number helps you avoid two major pitfalls: underutilization (which is just leaving money on the table) and burnout (from overworking your top talent). If you want to get into the nitty-gritty, you can learn more about how to calculate utilization rate and set smart targets for your teams. This single metric gives you the hard data you need to make better staffing decisions, forecast when you’ll need to hire, and just generally run a more productive and profitable agency.
How to Build a Modern Project Metrics System

This is what a modern metrics engine room looks like: calendar data syncing seamlessly with powerful dashboards. It’s the key to getting a live, unified view of project activities and turning raw data into real business intelligence.
Creating a system for tracking project metrics in project management shouldn't become another full-time job for you or your team. The real goal is to ditch the unreliable manual timesheets and static spreadsheets for good.
In their place, you can build an automated, intelligent framework that actually works. A modern system really comes down to three core stages: automated data capture, intelligent categorization, and dynamic visualization.
Stage 1: Automated Data Capture
First things first: you have to eliminate the biggest source of error and frustration—manual data entry. Stop asking your team to remember what they worked on last Tuesday. Instead, capture the data directly from the tools they already live in, like Google or Outlook calendars.
This works because calendars are already the unofficial record of how our time is spent. Client calls, internal meetings, and focused work blocks are all scheduled there. By plugging directly into this source, you get a complete, objective picture of activity without adding any administrative headaches for your team.
"Automated data capture isn't just about saving time; it's about fundamentally improving data integrity. When the system of record is the same system where work is planned, the accuracy of your project metrics skyrockets."
This hands-off, calendar-linked approach ensures data is captured consistently and without bias. It creates the reliable foundation you need for any real analysis.
Stage 2: Intelligent Categorization
Once you have a steady stream of raw activity, the next challenge is to make sense of it all. This is where rule-based automation becomes your best friend. A smart system lets you create rules that automatically tag activities to the right project, client, or task type.
For instance, you can set up rules based on keywords in a meeting title ("Project Phoenix Kickoff"), the attendees (any meeting with the client's email domain), or even the specific calendar an event came from. This automated tagging transforms a chaotic feed of events into clean, structured data ready for reporting. It’s the critical step that connects raw hours to meaningful business context.
Stage 3: Dynamic Visualization
Finally, you need to bring your metrics to life. Spreadsheets that get updated weekly (if you're lucky) just don't cut it anymore. The last stage is to feed your neatly categorized data into real-time, dynamic dashboards.
These dashboards give you an at-a-glance view of project health, showing the specific KPIs that matter most to your agency—from billable utilization to project margin. To get a feel for what’s possible, you can check out some great performance dashboard examples.
This move toward automation isn't just a niche trend; it’s a massive industry shift. The project management software market, valued at $6.1 billion in 2021, is on track to hit $15 billion by 2030.
But here's the kicker: while 77% of high-performing organizations depend on these tools, a stunningly low 23% of organizations overall actually use them. That gap represents a huge opportunity for agencies to get a competitive edge by building smarter systems.
A platform like TimeTackle is designed to unify these three stages. It turns your team's existing calendar data into a single source of truth for all your key project metrics.
Common Pitfalls to Sidestep When Tracking Project Metrics
Jumping into project metrics is a fantastic move, but the road to a successful rollout is paved with a few common traps. I’ve seen plenty of well-meaning agencies stumble, not because their goals were off, but because their approach had some serious flaws. Knowing what these pitfalls look like is the first step to building a measurement system that actually clarifies your operations instead of complicating them.
The biggest mistake? Tracking the wrong things. It's so easy to get mesmerized by numbers that look good in a report but tell you absolutely nothing about project health or, more importantly, profitability.
Chasing Vanity Metrics
The classic blunder is getting obsessed with vanity metrics. These are the numbers that are simple to measure and often make the team look busy, but they don't actually signal real performance. For example, a design agency might give themselves a high-five for logging over 500 hours on a major project. On the surface, it sounds like a hard-working, dedicated team.
But what if that project was only budgeted for 300 hours? All of a sudden, that metric flips from a badge of honor to a bright red flag signaling a massive budget overrun. The number of hours worked doesn't tell the real story; the real story is about delivering value within the scope you promised.
The fix is to connect every single metric back to a core business goal. Forget "hours logged" and start tracking Project Margin or Budget vs. Actuals. These numbers tell you if your hard work is actually turning into profit—which is what keeps the lights on.
Tolerating Inconsistent Data
Another huge pitfall is letting data consistency slide. It's the old "garbage in, garbage out" problem, and it's very real. If your team members are all tracking time in their own unique way—some rounding up, others using vague descriptions, and a few just forgetting to do it at all—your data becomes totally unreliable.
Think about an agency where one PM logs all internal meetings as "Admin," but another tags them to a specific client. When you pull a report to figure out project profitability, the numbers are a complete mess. You simply can't make smart business decisions when your foundation is built on shaky, inconsistent data.
This is where automation becomes your best friend. When you capture data directly from a single source of truth, like your team’s calendars, you kill manual entry errors at the source and make sure every minute gets categorized by the same set of rules.
Suffering From Analysis Paralysis
Finally, it’s dangerously easy to get stuck in analysis paralysis. This is what happens when you collect so much data that you're completely overwhelmed. Your dashboards are overflowing with charts and graphs, but you have no earthly idea what to do with any of it. Drowning in data is just as bad as having no data at all.
For instance, I've seen agencies try to track 15 different KPIs for every single project. The moment a project starts to veer off course, the sheer volume of information makes it impossible to quickly figure out what's actually going wrong.
To keep this from happening, start small and stay focused.
- Limit your focus: Kick things off with just three to five core metrics that line up with your biggest business goal right now.
- Define clear actions: For each metric, decide ahead of time what you'll do if it flashes red. No hesitation, just action.
- Iterate and expand: Once you’ve got your core metrics dialed in and the team is acting on them, you can slowly start adding more as you need them.
By steering clear of these common mistakes, you can build a system for project metrics in project management that provides genuine clarity and helps you make the strategic moves that lead to real growth.
Turning Project Data Into Strategic Business Decisions

Let's be honest, tracking project metrics in project management isn't just about keeping individual projects from going off the rails. The real magic happens when you elevate that data from a simple report to a strategic asset that guides the entire business.
Think of your project data less like a collection of disconnected spreadsheets and more like a high-level intelligence briefing for your agency’s leadership. This is where your metrics system truly starts paying dividends, informing critical decisions that reach far beyond the scope of a single project.
For example, if you consistently see low Project Margins on a specific type of service, that’s not a project-level problem. It’s a bright, flashing sign that something might be broken in your sales and scoping process. The numbers are telling a story that your sales team absolutely needs to hear.
From Project Insights To Business Strategy
The trends you spot across multiple projects should feed directly into your long-term business planning. It's about shifting from reactive problem-solving to proactive, strategic adjustments.
- Guide Hiring and Growth: Is Billable Utilization constantly maxed out for your design team? That’s not just a project management headache; it’s a clear indicator you need to hire more designers to support growth without burning out your best people.
- Strengthen Client Relationships: When client satisfaction metrics start to dip for a key account, your project data acts as an early warning system. This gives your account managers a chance to step in, fix issues, and even find expansion opportunities before the relationship is ever at risk.
Project metrics aren't just for project managers. They're essential intel for COOs, VPs, and agency owners. They deliver the objective truth you need to steer the company toward sustainable growth.
The message here is simple: stop guessing and start measuring. When you have the right tools and a commitment to a data-driven culture, project metrics transform from a reporting chore into your agency’s sharpest strategic advantage.
Ready to build a system that delivers these kinds of insights? See how a calendar-based platform can make it happen at TimeTackle.
Of course. Here is the rewritten section, crafted to sound natural and expert-driven, following the provided style guide.
Common Questions About Project Metrics
Even with a solid plan, questions always pop up when you start tracking project metrics. Let's tackle some of the most common ones we hear from agency leaders.
How Much Work Is This to Set Up?
Honestly, it depends on the path you choose. If you go the manual route with spreadsheets, you're signing up for a lot of upfront work and constant upkeep. It’s a heavy lift.
But modern tools flip the script. They plug directly into data sources you're already using—like your team's calendars. This completely changes the game. Instead of tedious data entry, you're just setting up a few rules for how to categorize everything.
How Do I Get My Team on Board Without Seeming Like a Micromanager?
This is a big one. The key is to position metrics as a shield for the team, not a surveillance tool. You have to focus on the outcomes that make their lives better, like protecting them from endless scope creep or preventing burnout before it happens.
When your team sees you using data to justify hiring another person or to push back on an unreasonable client request, they’ll start seeing metrics as their ally.
The secret? Be transparent. Share the dashboards. Highlight team wins and point out the real operational bottlenecks. It turns into a collaborative effort to fix workflows, not just another top-down directive.
What’s the Real Difference Between Project KPIs and Business KPIs?
Think of it like this: a single game versus the entire season.
- Project KPIs are your in-the-moment, tactical stats. Things like Budget vs. Actuals for a specific client job. They tell you if you're winning this particular game.
- Business KPIs are the long-term, strategic numbers. This is your overall Agency Profitability or your Annual Client Retention Rate. They tell you if you're on track to win the championship.
Ultimately, strong project performance is what fuels those bigger business results. It’s how you connect the team's daily grind to the company's grand vision.
Stop guessing and start getting clear answers. TimeTackle turns your team's calendar data into the project metrics you need to make smarter decisions. See how it works at https://www.timetackle.com.