If you’ve ever found yourself staring at another chaotic spreadsheet, you know the familiar pain of manual resource planning. For agencies, a purpose-built resource allocation template in Excel can be a powerful, low-cost way to get a real handle on workloads, prevent burnout, and keep projects in the black.
Why a Generic Spreadsheet Fails Your Agency
In a fast-paced agency, a generic Excel sheet doesn't just get messy—it quickly becomes a liability. When you're juggling multiple client projects, shifting deadlines, and shared team members, it’s the perfect storm for manual tracking to completely fall apart. And this isn't just an organizational headache; it has real, tangible costs.
When a marketing agency is managing even a handful of projects at once, hidden over-allocations are almost guaranteed without a clear, visual system. It's no surprise that one study found companies adopting advanced Excel templates saw a 30% improvement in resource utilization.
Without that structure, it’s all too common for team members to be silently assigned to 120% of their actual capacity. This inevitably leads to burnout and contributes to an average of 20% project delays. You can dive deeper into the good, the bad, and the pointless of relying on basic spreadsheets versus other tools in our detailed guide.
This kind of reactive environment creates a few critical problems that probably sound familiar:
- Hidden Over-allocations: Without a central view, it’s impossible to know if your lead designer is booked for 40 or 60 hours next week until it’s far too late.
- Surprise Deadline Misses: A small delay on one project kicks off a domino effect, pushing back other deliverables without any warning.
- Fuzzy Project Profitability: When you can't accurately track planned versus actual hours, you lose sight of which clients and projects are truly profitable.
A well-structured template isn’t just a list. It acts as a dynamic dashboard, turning data from other tools into a central hub for making smart decisions. It transforms Excel from a simple record-keeper into a strategic planning instrument.
The shortcomings of basic spreadsheets are clear, but jumping to complex, dedicated software isn't always the right move either.
Basic Spreadsheets vs Advanced Templates
For growing agencies, the limitations of a simple spreadsheet become painful quickly. Here’s a look at how a structured template helps overcome those common challenges.
| Challenge | Impact of Basic Spreadsheet | Advantage of Advanced Template |
|---|---|---|
| No Central View | Impossible to see the full team workload at a glance. | Provides a unified dashboard of all projects and assignments. |
| Prone to Human Error | Manual data entry leads to typos, broken formulas, and bad data. | Uses formulas and conditional formatting to automate calculations and flag errors. |
| Doesn't Scale | Becomes unwieldy and slow with more projects and team members. | Designed to handle complexity and can be easily expanded. |
| Lack of Insight | Just a list of names and hours; no real performance or profitability data. | Generates reports on utilization, capacity, and project budget tracking. |
Ultimately, a dedicated template serves as the perfect middle ground. It offers far more power and visibility than a blank sheet without the cost and learning curve of entirely new software. This approach sets the stage for a more organized, predictable, and profitable workflow.
Building Your Template Foundation in Excel
Ready to build something that actually works? A powerful resource allocation template in Excel doesn't need to be complicated. The best approach I've found is to focus on a practical, scalable foundation built around three interconnected sheets. This structure neatly separates your core data, making the template far easier to manage and update down the road.
Imagine you're an operations manager gearing up for a major new client launch. Your first move should be creating dedicated worksheets to house your fundamental data. This separation is the secret to avoiding the chaos that plagues those monster single-sheet trackers—a mess that almost always leads to burnout and blown deadlines.
I've seen it happen countless times. The process usually looks something like this:
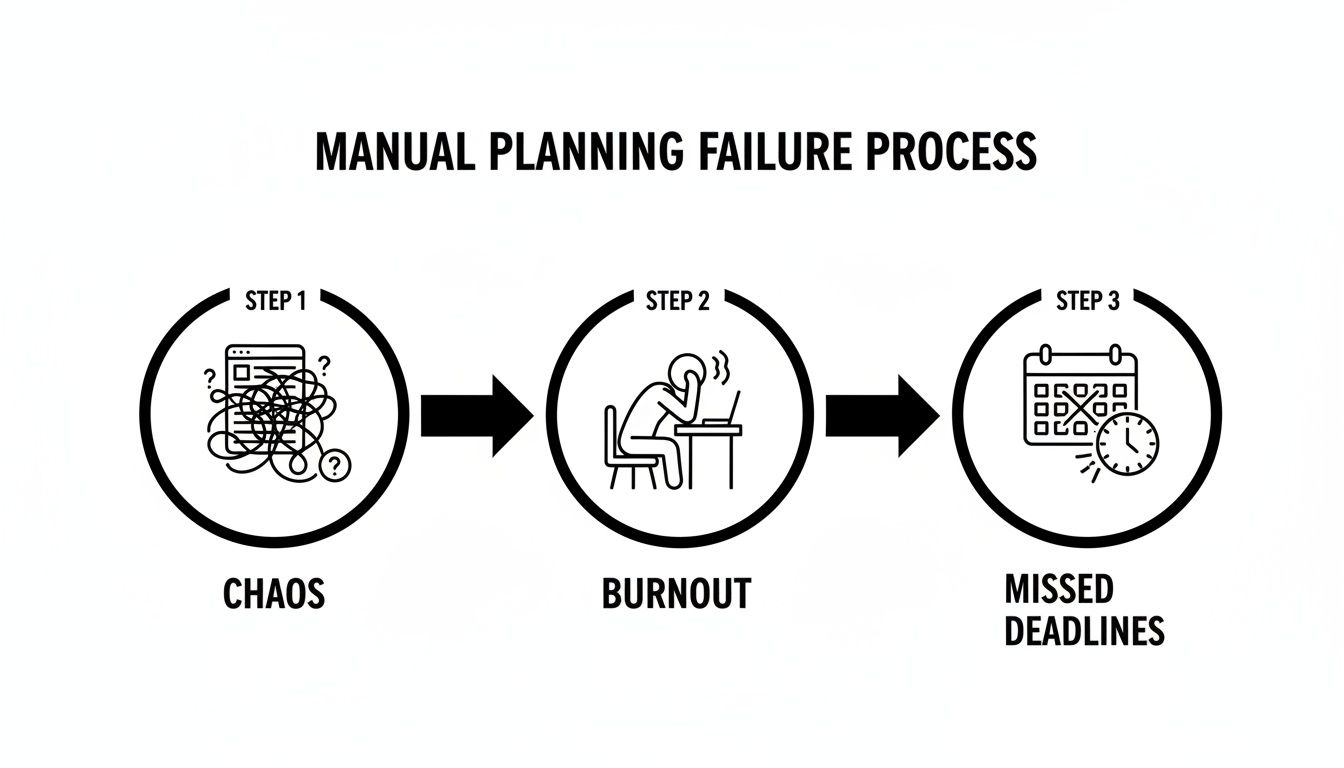
This visual nails it. It shows just how quickly unstructured planning spirals from manageable chaos into team burnout and, eventually, critical project delays. A structured three-sheet system gives you the clarity to sidestep this entire downward spiral.
Defining Your Core Data Sheets
Your template's real power comes from how these sheets talk to each other. Let's create them one by one.
1. The 'Projects' Sheet
Think of this as your project database. Start a simple table with columns for Project Name, Client, Start Date, and End Date. Keeping this info on its own sheet means you can add, archive, or update projects without ever messing up your main allocation view. Clean and simple.
2. The 'Team Members' Sheet
Next up, a sheet to list your crew. This table needs columns for Team Member Name, their Role (like Designer or Developer), and their Weekly Capacity in hours (e.g., 40). This sheet becomes your single source of truth for who's available and what they do.
For a more advanced setup, you can dive deeper into building out a robust capacity planning template in Excel that really expands on this idea.
Pro Tip: Use Excel's Data Validation feature on your 'Allocation' sheet. This lets you create dropdown lists that pull directly from the 'Project Name' and 'Team Member Name' columns you just made. It’s a simple trick that completely eliminates typos and keeps all your data perfectly consistent.
3. The 'Allocation' Sheet
This is the main event—the central hub where everything comes together. Set it up with columns for Team Member, Role, and Project. Then, add columns for each week or month you plan to track (e.g., "Week 1," "Week 2," "Oct-24"). This is where you'll plug in the hours each person is assigned to a specific project.
With this foundation in place, your template is now perfectly prepped for the formulas that will bring it to life.
Powering Your Template with Essential Formulas
Alright, you’ve got your three sheets set up—the foundation is solid. But let's be honest, a static list of names and projects is only half the battle. The real power of an Excel resource planner comes from the formulas that do the heavy lifting for you, turning that raw data into something you can actually use.
You don't need to be an Excel wizard here. A few key functions are all it takes to stop the manual number-crunching and get immediate answers. This is about solving real-world problems, like figuring out if your lead designer is overbooked next month without having to manually add up hours in a calculator. The right formula tells you in seconds.
Calculating Totals with SUMIFS
First up, and arguably the most critical formula for any resource template, is SUMIFS. This little powerhouse lets you add up numbers based on several different conditions at once. Think of it like asking Excel, "Show me the total hours Jane Doe is assigned to the 'Website Redesign' project over the next three weeks."
It's a complete game-changer for spotting when you've accidentally booked someone for 60 hours in a 40-hour week. I once saw an architecture firm that was just using basic SUM and IF formulas find 18% overlaps in staff assignments. By switching to a more dynamic approach and reallocating those hours, they pushed their team's utilization up to a staggering 90% and cut down project overruns significantly.
The basic syntax looks like this:=SUMIFS(sum_range, criteria_range1, criteria1, criteria_range2, criteria2)
- sum_range: This is the column with the hours you want to total up.
- criteria_range1: The column where your first condition lives (like team member names).
- criteria1: The specific person you're looking up.
- criteria_range2: The column for your second condition (like project names).
- criteria2: The specific project you're filtering for.
Pulling Data with XLOOKUP
Next, we need to tie your data together. For this, we'll use XLOOKUP, the modern and much more flexible replacement for the old VLOOKUP. It’s perfect for pulling information from one table into another. For example, in your 'Allocation' sheet, you can automatically pull in a team member's role or department from your 'Team Members' sheet just by entering their name.
This keeps your main planning view clean and—more importantly—consistent. If someone's role changes, you only have to update it in one place (the 'Team Members' sheet), and every cell referencing it will update automatically. No more hunting down every instance of "Junior Designer" to change it to "Designer."
Tracking Remaining Capacity
Finally, the simplest yet most insightful formula is basic subtraction. Once you've used SUMIFS to get a person's total allocated hours for the week, you just need to compare it against their available capacity.
The formula is as straightforward as it gets:
= [Cell with Weekly Capacity] - [Cell with Total Allocated Hours]
This one calculation instantly shows you who has room for more work and who's heading for burnout. It’s the red flag you need to see before it’s too late. When you weave this logic together with a few other essential Excel timesheet formulas, you create a surprisingly powerful system for tracking planned versus available time.
By getting comfortable with these few functions, your template goes from being a simple spreadsheet to a dynamic tool that gives you real-time intelligence on your team's workload.
Visualizing Workloads with Dashboards and Heatmaps
Let's be honest, raw numbers and formulas are only half the story. The real magic happens when you turn that data into something visual—something that helps you make quick, confident decisions. This is where your Excel template evolves from a simple tracker into a true command center for your projects. The goal here is to build a clear dashboard that lets you spot bottlenecks long before they become project-derailing problems.

The quickest and most effective visual you can add is a workload heatmap. By using Excel’s Conditional Formatting, you can instantly flag who’s over-allocated, who has bandwidth to spare, and who’s right in the sweet spot. It's a simple but incredibly powerful way to make overallocation issues impossible to ignore.
In fact, a lack of clear workload views is a major reason why traditional templates fail 40% of the time in mid-sized companies, leading directly to overallocation in a staggering 55% of cases.
Creating a Workload Heatmap
Setting up a heatmap is surprisingly easy and adds immediate value. Here’s how to get it done:
- Select Your Data: First, highlight the cells showing the total allocated hours for each person on your team.
- Apply Formatting: Navigate to
Home > Conditional Formatting > Color Scalesand pick a Green-Yellow-Red scale. This will instantly color-code your data. - Fine-Tune the Rules: To make it truly useful, go back into
Conditional Formatting > Manage Rules. Edit the rule you just created to set specific number-based thresholds. For a standard 40-hour workweek, your rules might look something like this:- Green (Good): Numbers between 35 and 40.
- Yellow (Warning): Numbers between 41 and 45.
- Red (Overallocated): Any number greater than 45.
This simple visual cue is a game-changer. When you glance at your dashboard and see a sea of red, you know exactly where you need to re-evaluate assignments and start a conversation.
Adding Simple Charts and Summaries
While heatmaps are great for a quick overview, a couple of other visuals can offer deeper insights. For instance, a basic bar chart is perfect for tracking project budget burn by comparing planned vs. actual hours logged.
You can also use PivotTables to slice and dice your data. A PivotTable can quickly summarize resource utilization by role, helping you answer critical questions like, "Are my designers consistently over capacity while developers are underutilized?"
If you're looking for inspiration on how to visualize planned work against resource commitments, exploring different product roadmap templates can offer some great ideas for your dashboard. Remember, the goal isn't to create a complex, data-heavy report. It’s to build a simple command center that helps you make proactive, informed decisions.
Making the Template a Part of Your Daily Grind
A shiny new resource allocation template is great, but it’s just a file until you make it part of your agency's heartbeat. To get real value out of it, you need to weave it into your team's regular operations. It has to become a living tool, not something that collects digital dust.
The secret is simple: build a routine.
Most teams I've worked with find a weekly review hits the sweet spot. Block out just 30 minutes every Friday afternoon. Use that time to plug in the assignments for the upcoming week. It’s a small commitment that keeps your data fresh and your plans grounded in reality.
![]()
Bridge the Gap to Your Other Tools
Now for the real power move: connecting your template to the systems you already live in every day.
Got time tracking software? Perfect. Export that data and paste it into a new "Actuals" tab in your spreadsheet. Suddenly, you can see your planned hours right next to the real-world effort. This one move transforms your template from a simple forecasting sheet into a powerful engine for analyzing project profitability and team efficiency.
To really get the most from this, you'll want to explore some actionable resource allocation strategies you can build right into this workflow.
This whole process closes the feedback loop. You're no longer just guessing at future capacity. You're learning from exactly what happened last week to make smarter, data-backed decisions about next week.
The goal is to create a sustainable process. The less manual entry, the better. Your template should be a source of continuous, strategic value, not another chore on your to-do list.
Common Questions About Excel Resource Allocation
Even with the best template in the world, you're going to have questions. It's just the nature of the beast. Let's walk through some of the most common ones that agency operators run into when they first start wrangling a new resource allocation template in Excel.
How do I handle part-time employees or contractors?
This is probably the first question everyone asks. You've got team members who don't fit the standard 40-hour workweek, so how do you account for them?
It’s a simple fix. Just head over to your 'Team Members' sheet and adjust their Weekly Capacity. Instead of 40, punch in their actual contracted hours—maybe it's 20 for a part-timer or 25 for a contractor. This single change ensures all your capacity and utilization formulas stay dead-on accurate.
What’s the best way to manage company holidays?
Another big one is dealing with team-wide holidays or PTO. The last thing you want to do is go in and manually zero out capacity for a dozen different people across multiple days. That’s a recipe for mistakes.
The easiest way around this is to treat the holiday like a project. Seriously. Add a new row in your 'Projects' sheet and call it "Company Holiday" or "Team Offsite." Then, just "allocate" your team members to that "project" for the day(s) they're out. This automatically pulls their available time out of the pool for real project work.
Help! My Project's Scope Just Exploded.
Ah, the classic scope creep. It happens. A client loves your work and asks for "just one more thing." So, what do you do in your spreadsheet when that happens?
First, don't panic. Go straight to your 'Projects' sheet and update that project’s timeline and budget to reflect the new reality. Then, hop over to the 'Allocation' sheet and plug in the additional hours needed.
Doing this right away is crucial. It gives you an immediate, visual gut-check on how that change impacts your team's capacity. You’ll see instantly if you need to shuffle other deadlines or, more importantly, if it’s time to tell the client you’ll need to bring in more help. This keeps your plan honest and your conversations realistic.
Are you ready to ditch the manual spreadsheet updates for good? TimeTackle uses an AI-powered platform that hooks right into your team's calendars, giving you real-time insights on utilization and project profitability without ever having to enter data by hand. Check out how TimeTackle can automate your resource planning.