So, what exactly is resource utilization? In simple terms, it's a metric that shows you how much of your team's available time is actually spent on productive, billable work. It’s the single most important KPI that reveals how efficiently your agency turns its most valuable asset—time—into revenue.
Understanding Resource Utilization Without the Jargon

Let's ditch the business school definitions for a moment and think about it like this: imagine you’re running an elite restaurant kitchen. Your team of skilled chefs are your employees, their premium knives and pans are your tools, and their time on the clock is your most precious, non-renewable resource.
High utilization in this kitchen is a beautiful sight. Every station is humming with activity. Chefs are chopping, searing, and plating incredible dishes that are flying out to happy, paying customers. It's a symphony of productive energy that directly fuels the restaurant's bottom line.
Now picture the opposite. Low utilization is like having those same highly-paid chefs just standing around while expensive, fresh ingredients wilt on the counter. Their incredible skills are going to waste, time is ticking away, and the business is actively losing money with every passing minute.
This gets to the heart of it: resource utilization isn't just about being "busy." It's about making sure that busyness is channeled into valuable, billable work that keeps the lights on and drives growth.
The Difference Between Busy and Productive
At its core, understanding resource utilization means knowing the difference between motion and progress. An employee might have a calendar packed with internal meetings, admin tasks, and company town halls. They feel busy, but if none of that time contributes directly to a client project or a strategic business goal, you have a productivity gap.
This single metric is the heartbeat of any professional services business. It gives you clear, data-driven answers to the fundamental questions that dictate your profitability and long-term health:
- Are our people spending their time on the right things?
- Do we actually have the capacity to take on that exciting new client?
- Is that one project secretly draining way more resources than it's worth?
- Is anyone on the team creeping toward burnout from an unsustainable workload?
Flying blind without a firm grasp on utilization is like guessing about the financial health of your company. It’s a risky game you can’t afford to play.
Key Takeaway: Resource utilization measures the percentage of available time your team spends on productive tasks. The goal isn't to hit 100%—that’s a guaranteed recipe for burnout—but to find the sweet spot that maximizes output without overwhelming your people.
To put these ideas into a simple framework, here's a quick cheat sheet.
Resource Utilization at a Glance
| Concept | What It Means for an Agency | Primary Goal |
|---|---|---|
| Resource Utilization | The percentage of an employee's total available hours spent on productive, billable, and strategic work. | Balance productive output with team well-being. |
| Productivity | The efficiency of turning hours worked into valuable outcomes for clients and the agency. | Maximize the value generated from every hour worked. |
| Capacity | The total number of hours your team is available to work, serving as the baseline for utilization calculations. | Understand the full potential of your team's time. |
| Profitability | The financial result of high utilization, where billable work effectively covers all operational costs and generates profit. | Ensure the agency is financially healthy and sustainable. |
This table shows how these concepts are all interconnected, with utilization being the central metric that influences everything from individual productivity to overall business profitability.
Why It Matters Beyond the Numbers
Ultimately, mastering this metric gives you a much deeper, more intuitive understanding of your business operations. When you know how to track and optimize resource utilization, you are really learning How to Improve Workplace Productivity with Smart Strategies.
It forces a shift in focus from just tracking hours to making every single hour count. This is the true foundation for pricing your projects accurately, forecasting revenue with confidence, and building a resilient, high-performing team that can go the distance.
Why Utilization Is Your Agency's Most Important Metric
If you're in the business of selling expertise, resource utilization is the direct line connecting your team's hard work to your bank account. It's so much more than a number on a spreadsheet; think of it as the single best indicator of your agency's operational health. Without a clear view of utilization, you're flying blind—making huge business decisions on guesswork instead of cold, hard data.
This one metric lets you stop hoping for profitability and start actively engineering it. It gives you the clarity you need for accurate project pricing, predictable revenue forecasting, and spotting burnout risks before they wreck your team's productivity. In short, it’s how you figure out which clients are fueling your growth and which are quietly bleeding you dry.
And let's be honest, the pressure to be efficient is only getting more intense. Global resource consumption is accelerating at a wild pace, forcing every business to think differently about efficiency. Between 2015 and 2022, the total amount of materials used within economies worldwide jumped by a staggering 23.3%. For a service business, the lesson here is crucial: utilization isn't just about time. It's about how efficiently you turn all your inputs—talent, tools, and energy—into valuable outcomes. You can dig into more data on global resource trends to see the bigger picture.
A Tale of Two Agencies
To really see how much utilization matters, let’s imagine two agencies. They have similar talent, similar clients, and similar ambitions.
Agency A: Flying Blind. This agency just wings it. They price projects based on a "gut feeling," which usually means they're underbidding. Scope creep runs wild because they have no data to prove how much extra work is actually being done. Their best people get pulled into endless non-billable meetings, and the team is caught in a cycle of being overworked on some projects and bored on others. The result? Razor-thin margins, a frustrated team, and cash flow that’s all over the place.
Agency B: Data-Driven. This agency lives and breathes utilization data. They know exactly how much time projects really take, so they can price new work with confidence and guarantee a profit. When a client asks for "one more quick thing," they can pull up the numbers and justify the extra budget. They protect their team's time, making sure everyone has a healthy mix of billable work, important internal projects, and actual downtime. The result is steady growth, happy people, and profitable clients who stick around.
Agency B isn't using magic. They're just treating resource utilization like the mission-critical metric it is.
Key Insight: Ignoring resource utilization is like trying to drive across the country without a map. Managing it gives you the data-driven GPS you need to steer your agency toward consistent profits and sustainable growth.
The Strategic Advantages of Tracking Utilization
When you start paying close attention to how your team’s time is spent, you unlock some seriously powerful advantages that go way beyond just making sure people look busy.
1. Nail Your Project Scoping and Pricing
Your historical utilization data is your secret weapon in the sales process. It allows you to confidently estimate how much effort a new project will take, build proposals that are actually profitable, and sidestep the all-too-common trap of underpricing your services.
2. Get Ahead of Burnout
Consistently high utilization rates (think 90% and above) are a massive red flag for burnout. By keeping an eye on these trends, you can step in before it's too late. You can redistribute the workload, bring in more help, or adjust timelines to protect your team's well-being and keep the quality of your work high.
3. Make Smarter Hiring and Capacity Decisions
Is it time to hire another developer? Should you bring on a new project manager? Your utilization data has the answer. When you see a department is constantly running at or over its ideal capacity, you have a clear, data-backed reason to grow the team. This shifts hiring from a reactive, panic-driven decision to a strategic move that fuels growth.
Okay, we've covered why resource utilization is so important. Now, let's get into the how.
You don't need to be a math whiz to get a handle on this stuff. In fact, there are just three core formulas that will give you a crystal-clear, data-driven picture of your agency's performance. Think of them as the vital signs for your business's health.
This visual shows how your team's effort translates directly into the overall well-being of your agency, with utilization acting as the critical link.
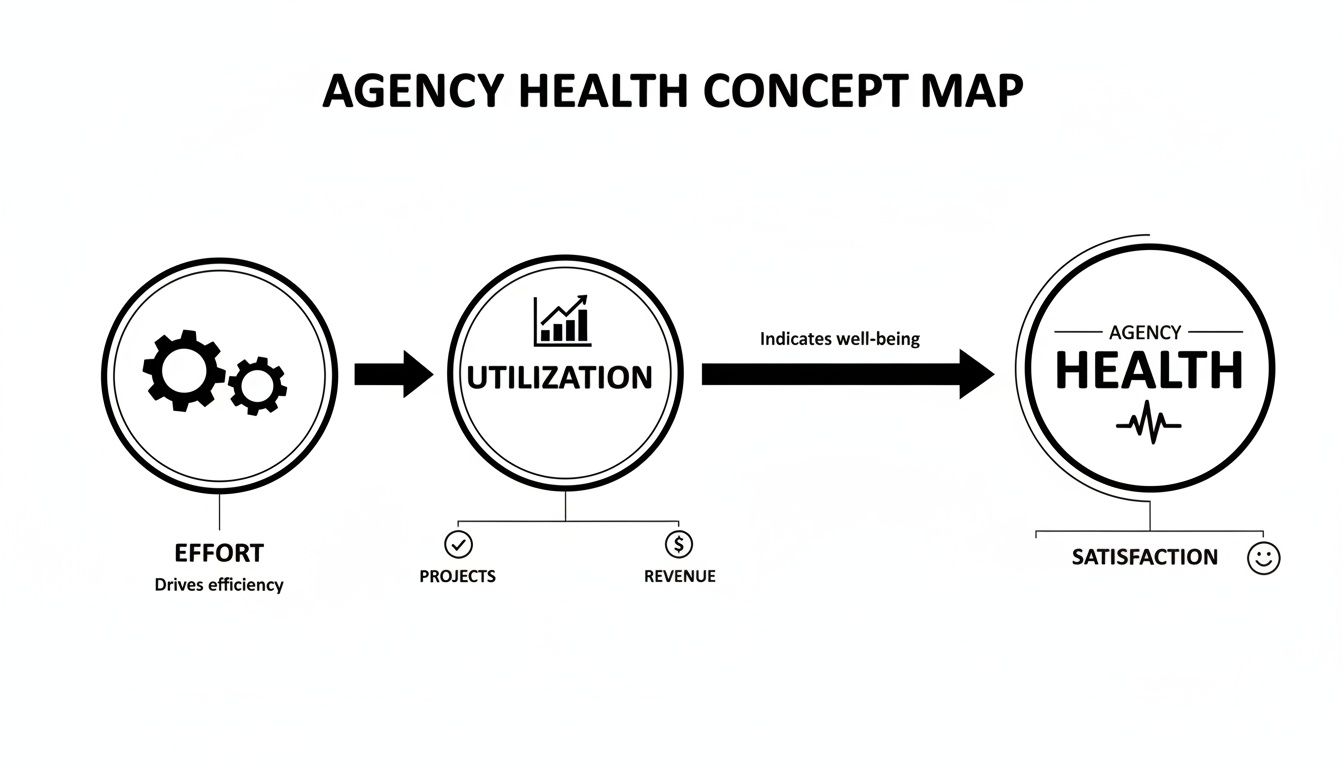
As you can see, utilization is the bridge between the hard work your team puts in and the profitable results you're aiming for. Let's break down exactly how to measure it.
1. Overall Utilization Rate
First up is the Overall Utilization Rate. This is your 30,000-foot view, a broad snapshot of your team's total productivity. It calculates the percentage of a person's available time spent on any productive work.
That includes both billable client projects and crucial non-billable activities like internal training, business development, or even planning the next company offsite. It tells you if your team has a healthy workload or if too much time is being lost to administrative black holes.
Formula: Overall Utilization Rate = (Total Hours Logged / Total Available Hours) x 100
Let's see it in action:
Imagine a small design agency with 10 full-time employees, each working a standard 40-hour week.
- Total Available Hours: 10 employees x 40 hours/week = 400 hours
- Total Hours Logged: In a given week, the team logs a combined 320 hours of work (client projects, internal meetings, everything).
- Calculation: (320 / 400) x 100 = 80%
An 80% overall utilization rate is a great sign. It shows the team is busy and engaged, but not so maxed out that there's no room to breathe or handle unexpected tasks.
2. Billable Utilization Rate
Next, we have the Billable Utilization Rate. For most agencies, this is the holy grail. It’s the metric that directly impacts your bottom line.
This formula gets specific, measuring the percentage of your team's time spent purely on work that generates revenue. It’s the clearest indicator of how efficiently you're turning payroll costs into profit. A low number here is a serious red flag. You can learn more about how to calculate utilization rate in our deep-dive guide.
Formula: Billable Utilization Rate = (Total Billable Hours / Total Available Hours) x 100
Let's go back to our agency:
They still have 400 available hours for the week.
- Total Available Hours: 400 hours
- Total Billable Hours: Out of the 320 total hours logged, 280 were for paying client projects.
- Calculation: (280 / 400) x 100 = 70%
A 70% billable rate is solid. It means the majority of their time is making money, while still leaving 10% of their total capacity (the gap between 80% overall and 70% billable) for those important internal tasks.
3. Capacity Utilization Rate
Finally, there’s the Capacity Utilization Rate. This one offers a slightly different, but equally valuable, perspective. Instead of measuring against total available hours, it compares the hours people worked against their target billable hours.
This is your secret weapon for forecasting and resource planning. It tells you if you have enough billable work in the pipeline to keep everyone productive or if you need to light a fire under the sales team to fill some upcoming gaps.
Formula: Capacity Utilization Rate = (Total Hours Logged / Total Billable Capacity) x 100
Let's run the numbers one last time:
Our 10-person agency has set a target billable rate of 75%.
- Total Billable Capacity: 400 available hours x 75% = 300 hours
- Total Hours Logged: The team logged 320 hours in total for the week.
- Calculation: (320 / 300) x 100 = 106.7%
A rate over 100% like this means the team actually worked more hours than the billable target. This might signal high demand and a great week for revenue, but it could also be an early warning sign of burnout if it becomes a regular occurrence.
Key Utilization Formulas Compared
Each of these formulas tells a different part of your agency's story. Looking at them together gives you a complete picture of your team's productivity, profitability, and overall operational health.
| Metric | Formula | What It Tells You | Ideal For |
|---|---|---|---|
| Overall Utilization | (Total Hours / Available Hours) | How much of your team's time is spent on any productive work. | Getting a high-level view of team engagement and busyness. |
| Billable Utilization | (Billable Hours / Available Hours) | How much of your team's time is directly generating revenue. | Measuring profitability and financial efficiency. |
| Capacity Utilization | (Total Hours / Target Billable Hours) | How your team's actual workload compares to your planned targets. | Forecasting future workload and planning resource needs. |
By tracking all three, you move from guesswork to a data-backed understanding of how your business really operates. You can spot problems before they escalate and make smarter decisions about everything from hiring to project pricing.
Common Mistakes in Tracking Resource Utilization
Knowing the formula for resource utilization is just the start. Actually getting meaningful data from it? That's a whole different ball game. Too many agencies fall into common traps that turn this powerful metric into a source of frustration, leading to flawed decisions and a burned-out team.
Let's walk through the biggest pitfalls so you can steer clear of them.
Mistake #1: The Tunnel Vision on Billable Hours
One of the most frequent errors is fixating only on billable utilization. While that number is absolutely critical for your bottom line, obsessing over it creates a dangerous blind spot. It starts to treat all non-billable time as "wasted" time, completely missing its strategic value.
Key Insight: Time spent on business development, team training, improving internal processes, or strategic planning isn't a cost—it's an investment in your future. When you penalize these activities to chase a higher billable percentage, you're sacrificing long-term growth for short-term gains.
This narrow focus often snowballs into the next major mistake: trusting bad data. When your team feels immense pressure to hit an arbitrary billable target, what happens? They might fudge their numbers or rush through timesheets, compromising the integrity of the very data you rely on to make decisions.
Mistake #2: Setting Unrealistic Targets
Here's a classic—and destructive—mistake: setting impossible utilization targets. Aiming for 100% utilization sounds great on a spreadsheet, but in the real world, it's a direct path to burnout. It leaves absolutely no breathing room for creative thinking, unexpected client requests, or even basic admin work.
People aren't machines. A healthy, sustainable model has to build in buffers for the realities of work life:
- Planned Time Off: Vacations, holidays, and sick days aren't surprises. They need to be factored into your capacity from the get-go.
- Administrative Work: Answering emails, joining all-hands meetings, and yes, even filling out timesheets are necessary parts of the job.
- Professional Development: You have to carve out time for training and learning. It’s how your team’s skills stay sharp and competitive.
A target of 80-85% billable utilization for your client-facing folks is a much more realistic and sustainable benchmark. It gives your team the space they need for important non-billable work and helps maintain a healthy work-life balance. To get this balance right, check out our deep dive into the differences between billable and non-billable hours.
Mistake #3: Ignoring the Bigger Picture of Resource Use
Today, tracking resource utilization goes beyond just employee hours. Think about the bigger picture. We're in the middle of a massive global energy transition, where electricity demand is surging. For a professional services firm that runs on cloud servers, data centers, and constant connectivity, this has real-world implications.
Understanding your energy consumption per resource hour is quickly becoming a critical, yet often overlooked, part of operational efficiency. As recent energy trend analyses show, teams that can't measure their productivity per watt are missing huge opportunities to optimize both costs and their environmental impact. You can explore the state of clean energy in this detailed report.
When you fail to account for these broader resource demands—from digital infrastructure to energy—you're only seeing part of the story.
Fixing these common mistakes is what transforms utilization tracking from a dreaded chore into a powerful strategic tool. It helps you build a more resilient, profitable, and sustainable business where both your people and your projects can thrive. It's about taking a more balanced view to gain the clarity needed to guide your agency toward real, long-term success.
Automating Utilization Tracking to End Timesheet Fatigue

Let's be honest: manual timesheets are the silent killer of productivity in any agency. They’re a constant source of friction, forcing your highly-paid, creative team to stop what they’re doing and try to piece together what they worked on three days ago. It’s a slow, frustrating, and notoriously inaccurate process.
This is the central flaw in measuring resource utilization. Your formulas can be perfect, but they’re completely useless if the data feeding them is garbage. This is where timesheet fatigue sets in, leading to guesstimates, forgotten tasks, and a completely warped view of your agency's health.
The good news? There’s a modern fix that ends this painful cycle for good. Imagine a system that captures time automatically by linking directly to the tools your team already lives in every day—like Google Calendar, Outlook, and your CRM.
The Power of Automated Time Capture
Automated time tracking flips the entire script on data collection. Instead of nagging your team to manually reconstruct their workweek, it passively gathers data from their digital footprint. This creates a complete and uncannily accurate picture of where their time and effort are actually going.
This approach delivers benefits that go way beyond just saving a few minutes each week. It strikes at the heart of the problems that make traditional utilization tracking such a headache.
- Drastically Improved Data Accuracy: Automation kills the guesswork. It captures every meeting, every call, and every scheduled work block, giving you a rock-solid foundation of truth for your utilization metrics.
- Countless Hours Saved: Just think of the cumulative time your team burns filling out timesheets—and the hours managers waste chasing them down. Automation hands all that time back, letting people focus on valuable, billable work.
- Real-Time Visibility: Stop waiting until the end of the month for reports. Automated systems offer live dashboards, giving you an immediate pulse on project health and team capacity without having to bug anyone for an update.
By connecting directly to your team’s calendars and project management tools, an automated system can provide dynamic, at-a-glance insights into utilization by project, client, or individual team member, solving the very measurement problems discussed throughout this guide.
From Raw Data to Actionable Intelligence
Just capturing time isn't quite enough; that data needs context to be useful. This is where rule-based automation becomes a total game-changer. You can set up simple rules to automatically categorize activities based on keywords, attendees, or project codes found in their calendar events.
For example:
- Any calendar event with "Client ABC" in the title is automatically tagged as billable work for that client.
- Internal meetings with just the marketing team are automatically categorized as non-billable business development.
This level of intelligent sorting ensures your utilization data is not only accurate but also rich with strategic insight. To see how automating this piece fits into a bigger picture of operational efficiency, it helps to understand what is workflow automation.
By implementing these kinds of systems, you can see firsthand how automated timesheets change the way you manage time and start building a more profitable, efficient, and resilient agency.
Your Resource Utilization Questions, Answered
Even when you've got the formulas down, some practical questions always pop up when you start tracking resource utilization. Agency leaders often ask us about the right benchmarks, how to define key terms, and the real-world limits of this metric. Let's dig into the most common ones.
What Is a Good Resource Utilization Rate for an Agency?
This is the million-dollar question, but the answer isn't a single magic number. An 80-85% billable utilization rate is a widely accepted industry benchmark for your client-facing folks, but the ideal target really hinges on an individual's role and your agency's bigger picture.
For example, you wouldn't expect a senior partner to hit 85%. Their ideal billable rate might be closer to 60%, since a big chunk of their time should be spent on high-value, non-billable work like business development or mentoring junior staff. On the flip side, a production-focused designer might be aiming for a much higher target.
Key Takeaway: The goal isn't just to hit a number. It's to set realistic targets that let your team shine in their core roles while leaving room for the essential non-billable work that fuels long-term growth.
How Is Resource Utilization Different from Resource Allocation?
It's easy to get these two mixed up, but they’re two sides of the same coin—planning versus reality. Think of it like planning a road trip versus actually driving it.
Resource Allocation is the plan. This is you, looking at the map. You see the upcoming projects in your pipeline and assign team members to tasks based on their skills and availability. It’s your strategic roadmap for how you intend to use your team's time.
Resource Utilization is the travel log. This is where you look back at the journey and see how that time was actually spent. It’s the real-world data that shows if you followed your planned route, took a few scenic detours, or got stuck in traffic.
You absolutely need both. Allocation sets your intentions, and utilization gives you the feedback to plan more accurately next time.
Can Resource Utilization Be Too High?
Absolutely. In fact, it's a dangerous trap to fall into. While sky-high utilization might look amazing on a spreadsheet in the short term, pushing for consistently astronomical rates (anything over 90-95%) is a recipe for disaster. This "all-out" approach leaves zero margin for error or opportunity.
Sustained high utilization quickly leads to some pretty nasty consequences that can seriously damage your agency:
- Employee Burnout: When your people have no breathing room, stress skyrockets, morale tanks, and your best talent will start polishing their résumés.
- Reduced Work Quality: Rushed, overworked employees are far more likely to make mistakes, cut corners to meet deadlines, and deliver work that's just "good enough" instead of great.
- No Time for Innovation: Your team gets stuck in the weeds. There's no space for them to learn new skills, improve internal processes, or think creatively about your clients' biggest problems.
Chasing maximum utilization is a short-sighted game. A healthy, sustainable agency builds in the capacity for its team to breathe, learn, and grow.
Stop chasing timesheets and start getting real-time, accurate insights into your agency's performance. TimeTackle automates time tracking by connecting to your team's calendars, giving you a crystal-clear view of resource utilization without the administrative headache. Discover how to improve profitability and reduce burnout today.