If you've ever tried to figure out how many working hours are in a year, you’ve probably landed on the number 2,080. It’s the quick and easy answer that comes from multiplying a 40-hour workweek by 52 weeks. But let’s be honest—that number feels a bit off, doesn't it? It's more of a theoretical guess than a real-world figure.
Your Starting Point: The 2,080-Hour Myth

The number 2,080 is the go-to figure for a reason—it’s simple, clean, and easy to remember. Think of it as the sticker price on a car; it’s a valid starting point, but it rarely reflects what you actually end up paying.
This number is the absolute baseline, a theoretical ceiling built on the assumption that an employee works every single weekday, all year long, without a single day off for holidays, vacation, or sick leave. Of course, that never happens. Real life gets in the way, and all those little interruptions start chipping away at this total.
Building The Foundational Math
Before we start subtracting for time off, we need to get our foundation right. After all, not everyone works a standard 40-hour week. Many companies operate on 37.5-hour or 35-hour weeks, and that difference completely changes the math.
Here’s how the basic calculation breaks down for a few common schedules:
- 40-Hour Workweek: 40 hours × 52 weeks = 2,080 hours
- 37.5-Hour Workweek: 37.5 hours × 52 weeks = 1,950 hours
- 35-Hour Workweek: 35 hours × 52 weeks = 1,820 hours
This first adjustment immediately shows how a small shift in weekly hours can lead to a huge difference over the course of a year. It's the first step toward building a more accurate picture of your true annual hours.
The Leap Year Factor
There's another small but important detail to consider: the leap year. Every four years, we add an extra day to the calendar, which usually means an extra workday. For a full-time employee working eight hours a day, this tacks on 8 additional hours to their annual total.
For example, 2024 was a leap year. This means the baseline calculation for someone on a 40-hour week in 2024 should have started at 2,088 hours, not 2,080. It’s a minor tweak, but when you're doing precise project planning or payroll, every hour counts.
The 2,080-hour figure is a myth not because it's wrong, but because it's incomplete. It's the starting block, the raw material from which we must sculpt a realistic, personalized, and far more useful number.
To make things easier, here's a quick reference table showing how annual hours shift based on both weekly schedules and whether it's a standard or leap year.
Annual Work Hours by Weekly Schedule
| Hours Per Week | Weeks Per Year | Total Annual Hours (Standard Year) | Total Annual Hours (Leap Year) |
|---|---|---|---|
| 40 | 52 | 2,080 | 2,088 |
| 37.5 | 52 | 1,950 | 1,957.5 |
| 35 | 52 | 1,820 | 1,827 |
This gives us a much more solid starting point. With this foundational math in place, we can move on to the next step: subtracting all the predictable time off, like public holidays and vacation, to get a number that truly reflects your time at work.
Subtracting The Predictable Public Holidays And PTO

The baseline number we’ve been working with is a great starting point, but let's be honest—it’s not reality. No one works every single weekday of the year. It's time to adjust that number to reflect your actual life, accounting for all the days you know you'll have off.
The easiest and most predictable deductions are public holidays. These are a given, but the exact number can vary wildly depending on where you are. In the United States, for instance, there are 11 federal holidays, but company policies and local customs often add a few more to the mix.
Calculating Your Holiday Hours
First things first, you need to turn those holiday days into hours. It’s a simple calculation: just multiply your total number of paid holidays by the hours in your standard workday.
Let’s walk through it with an employee who works a typical eight-hour day:
- Total Paid Holidays: 11 days
- Hours Per Workday: 8 hours
- Calculation: 11 days × 8 hours/day = 88 hours
These 88 hours are paid time, but they aren't working hours. They need to come right off your annual baseline to get us closer to an accurate total.
Factoring in Your Paid Time Off
Next up is your Paid Time Off (PTO), which usually covers vacation days, personal days, and any floating holidays you might have. This number is unique to you, depending on your contract and how long you've been with the company.
For our example, let's say a mid-career professional gets 15 days of vacation and 3 personal days.
The math is exactly the same as it was for public holidays:
- Add up all your PTO days: 15 vacation days + 3 personal days = 18 total PTO days.
- Convert those PTO days into hours: 18 days × 8 hours/day = 144 hours.
This step is where the calculation really becomes yours. Your company’s specific time-off policy has a direct impact on your annual work hours. Managing these requests smoothly is a big deal, which is why having a well-designed employee time off request form can make life easier for everyone.
Putting It All Together for an Accurate Total
Okay, now we combine these deductions and apply them to our original 2,080-hour baseline. This is where we get a much more realistic picture of your year.
Let's start by adding up all the time-off hours we've just calculated:
- Holiday Hours: 88
- PTO Hours: 144
- Total Time-Off Hours: 88 + 144 = 232 hours
Finally, we subtract this total from the standard annual hours to find our adjusted number.
(Baseline Annual Hours) – (Total Time-Off Hours) = Adjusted Annual Work Hours
Plugging in our numbers:
2,080 hours – 232 hours = 1,848 adjusted work hours
This new total of 1,848 hours is a far more accurate reflection of the time you’re actually expected to be working. We’ve just busted the generic 2,000-hour myth and replaced it with a number grounded in your real-world circumstances.
Accounting For The Unpredictable: Sick Days And Leave
So far, we've painted a pretty clear picture by subtracting planned time off like holidays and vacation. We have a solid number, but let's be honest—it's still a bit too perfect. Life happens. We need to account for the curveballs: sick days, family emergencies, and all the other unplanned absences that are just a part of being human.
You can't exactly pencil in "flu" on the Q3 calendar, but you can forecast its impact. This is where your calculation transforms from a simple estimate into a genuine strategic tool. By anticipating these absences, project managers can build timelines and budgets with a dose of reality baked in, preventing them from falling apart at the first sign of an unexpected leave.
Forecasting Unplanned Absences
How do you put a number on the unknown? The best way is to look at the past. Most companies track employee attendance, which can give you a solid average for sick days taken each year. If you don't have that data handy, national statistics are a great starting point.
For instance, workers in the U.S. private sector typically take between 5 and 10 sick days each year. To be safe, let's work with a conservative average of 8 days.
Here’s how that breaks down into hours for a standard eight-hour workday:
- Average Sick Days: 8 days
- Hours Per Workday: 8 hours
- Total Sick Leave Hours: 8 days × 8 hours/day = 64 hours
This simple adjustment acts as a buffer, making sure our final number for work hours in a calendar year is grounded in the real world, not just wishful thinking.
The Final, Most Realistic Calculation
Alright, let's put all the pieces together. We'll take our previously adjusted total of 1,848 hours (which already accounts for holidays and paid time off) and subtract the sick leave we just forecasted.
Adjusted Annual Hours – Forecasted Sick Leave Hours = Final Realistic Work Hours
Using our running example, the final step looks like this:
1,848 hours – 64 hours = 1,784 final work hours
This final figure, 1,784 hours, is where the magic happens. It's no longer a generic guess. It’s a data-informed forecast that respects both planned time off and life’s inevitable surprises, giving you a much more accurate estimate of the actual time an employee is likely to be working all year.
How Your Location Changes Everything
The idea of a "standard" work year completely dissolves the moment you pull up a world map. The number of hours you clock in isn't just a personal choice or a company policy; it's deeply woven into the fabric of national culture, labor laws, and economic realities. What’s considered a marathon workweek in one country might just be the starting line in another.
This isn't just a fun fact for your next trivia night. For anyone managing international teams, collaborating with global clients, or even just trying to benchmark their own work-life balance, this context is absolutely critical. Assuming everyone is running on the same 2,080-hour treadmill is a surefire recipe for miscommunication, blown deadlines, and wildly unrealistic expectations.
A Global Tour of Work Hours
The differences in annual work hours around the globe are genuinely staggering. You’ll find that developing nations and emerging markets often have work years that are significantly longer than those in more developed economies. For instance, among OECD nations, Colombia tops the charts with an average of 2,298 hours worked annually per employee. Mexico isn't far behind, consistently ranking as one of the highest in the world at 2,137 hours per year.
On the other end of the spectrum, you have Denmark, holding the title for the shortest working year at just 1,380 hours annually. This contrast paints a very clear picture: longer hours don't automatically translate to higher productivity or better pay. In fact, Danish workers earn about $55 more per hour than their Mexican counterparts, despite working far less. If you want to dive deeper into the data, the National Bureau of Economic Research offers a fascinating look at these variations.
This data really hammers home a crucial point: more time on the clock doesn't mean you're getting more done.
A country’s average annual work hours are a reflection of its economic policies, social safety nets, and cultural attitudes toward work and leisure. Understanding these differences is key to effective global collaboration.
Why More Hours Do Not Equal More Productivity
The belief that more hours worked leads directly to greater output is a stubborn myth that just won't die. The reality is, productivity tends to nosedive after a certain point. Fatigue kicks in, focus wavers, and the error rate starts to climb.
Here’s a look at why countries with shorter work years can still be economic powerhouses:
- Intense Focus: When you know the clock is ticking, you tend to cut out the fluff. Employees in these cultures often concentrate more intensely on high-value tasks, ditching distractions and "busy work."
- Better Well-being: It's simple, really. A healthy work-life balance reduces burnout and stress. This leads to a workforce that's more motivated, creative, and genuinely engaged in their work.
- Efficiency Drivers: Cultures with shorter workweeks don’t just work less; they work smarter. They often invest more heavily in technology and streamlined processes to get the most out of every single hour.
So, when you're trying to figure out how many work hours in a calendar year makes sense for your own team, looking at these international examples can be incredibly enlightening. It forces a shift in mindset—away from just counting the hours and toward making every hour count.
Finding Your Truly Productive Hours
After you’ve crunched the numbers on total hours, a much more important question pops up: how much of that time actually makes the business money? This is where we stop just counting hours and start digging into their real value. For anyone in a service-based business, especially agencies, nailing the difference between total hours, billable hours, and genuinely productive time is the secret to staying afloat.
The hard truth is that a huge chunk of any workday gets eaten up by essential but non-billable tasks. These are the activities that keep the lights on but aren't directly tied to a client's project. Think internal meetings, sorting out admin, professional development, and even those quick coffee runs that build team chemistry. These tasks are the invisible engine powering your company.
Billable vs Productive Time
Chasing a 100% billable rate isn't just a fantasy; it's a one-way ticket to burning out your team. When people feel the pressure to bill every last minute, the critical non-billable work gets shoved aside. The result? Operational chaos and plummeting morale. A smart agency knows that a realistic billable utilization rate usually lands between 70-80%. That other 20-30% is a necessary investment back into the business itself.
Getting this balance right lets you do a few key things:
- Price Projects Accurately: You can build quotes that cover both the direct client work and all the internal overhead needed to get it done right.
- Invoice Clients Fairly: It guarantees you're charging for focused, valuable work while managing expectations about what's included behind the scenes.
- Manage Your Team Sustainably: Leaders can set achievable performance goals that prevent burnout and foster a healthier work environment.
To really get a grip on where all this time is going, you have to do a proper analysis. The best way to start is to learn https://www.timetackle.com/how-to-do-a-time-audit/ to see exactly where your team’s hours are being spent.
The goal isn't just to track how many work hours are in a calendar year, but to understand the quality and purpose of those hours. Productive time is the ultimate metric for success, whether it's billable or not.
This infographic is a great snapshot of how different countries view the workweek, really driving home the global differences in work hours.
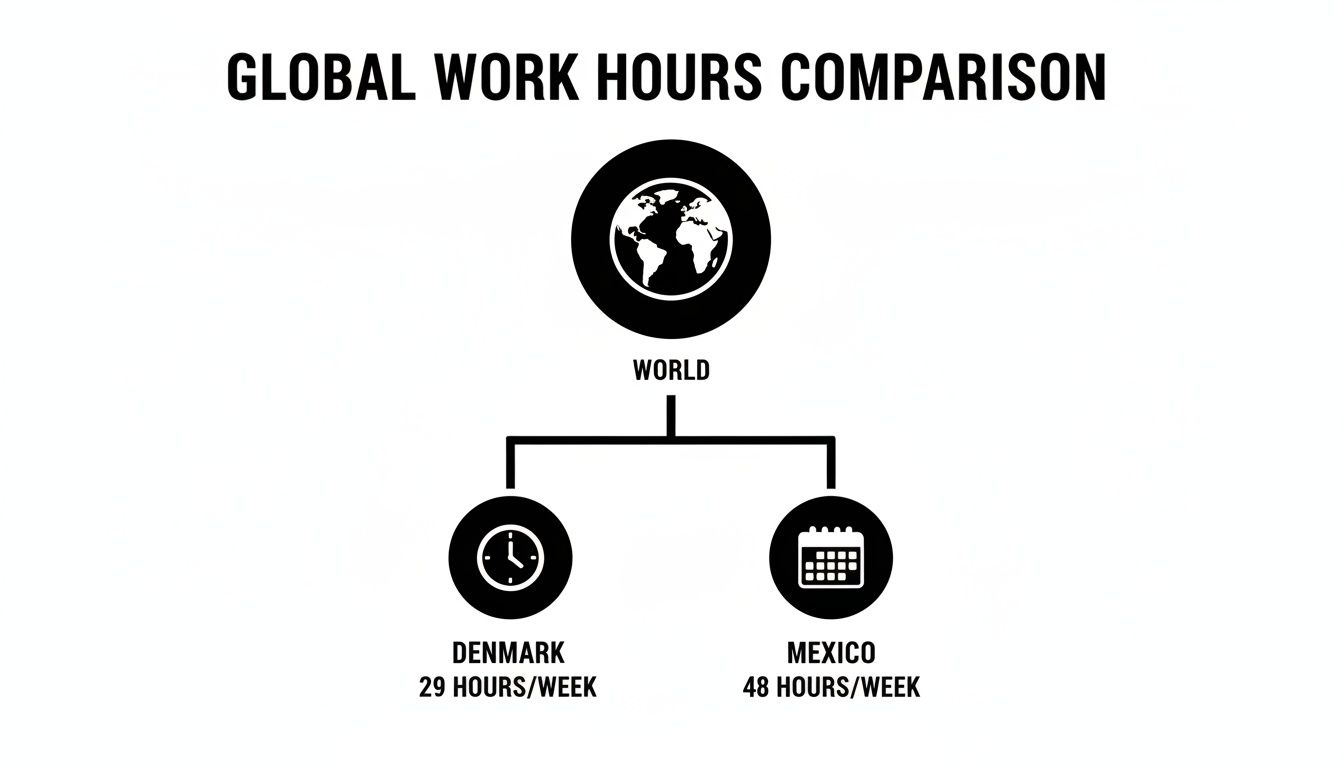
As you can see, more hours don't automatically mean more output. It’s a powerful reminder to focus on productivity, not just punching the clock.
Making Your Hours Count
Once you have your baseline numbers, the next move is to make every hour as effective as possible. For some great ideas on this, you can learn how to improve workplace productivity with strategies that prioritize efficiency over sheer volume.
When you shift the focus from just being present to delivering meaningful results, you build a system that values output, not just logged hours. That approach creates a stronger, more resilient, and—at the end of the day—more profitable business.
Moving From Manual Math To Automated Insights

If you're still calculating work hours with spreadsheets, you know the pain. It feels a bit like using a paper map to navigate a busy highway—it gets the job done, but it’s painfully slow, full of potential wrong turns, and instantly outdated. Every new project, sick day, or last-minute holiday request sends you back to the drawing board, making it a constant administrative headache.
This manual approach isn't just tedious; it's a breeding ground for errors. One misplaced formula or a forgotten meeting can throw off your entire year's forecast, impacting everything from project profitability to capacity planning. The first step away from this cycle is learning how to automate tasks so you can get accurate, advanced insights without all the manual grunt work.
Let Your Calendar Do The Heavy Lifting
Instead of chasing down timesheets filled out from memory, what if your team’s digital calendar could become your single source of truth? Think about it: every meeting, client call, and focused work block is already logged right there. This data is a goldmine just waiting to tell you exactly how work hours are being spent on specific activities throughout the year.
When you connect your calendar to an analytics platform, you can automatically capture and categorize every single event. Suddenly, you have a live, accurate dashboard showing your team's total, billable, and truly productive hours.
Your calendar isn't just a scheduling tool; it's a real-time log of your most valuable resource—time. Automating its analysis provides the clarity needed for smarter business decisions.
This shift frees you and your team from the endless cycle of filling out and chasing down timesheets. For a closer look at how this works in practice, our guide on how automated timesheets change the way you manage time lays out the practical steps to make the switch.
Making this change transforms how you see your business by delivering:
- Real-time data: Instantly see where time is going without waiting for end-of-week reports.
- Effortless accuracy: Eliminate the human error and forgotten entries that plague manual tracking.
- Strategic clarity: Make confident decisions about resource allocation based on actual data, not guesswork.
A Few Common Questions About Calculating Work Hours
Even with a clear process laid out, a few questions tend to pop up again and again. Getting these details right is the final step in refining your numbers and applying these concepts correctly across your entire team, no matter their role.
What Is The Easiest Formula To Calculate Annual Work Hours?
If you just need a quick, back-of-the-napkin number, the simplest formula is (Hours Per Week) x 52. For a standard 40-hour week, that lands you at the familiar 2,080 hours.
But let's be honest, nobody works every single one of those hours. For a much more realistic figure that actually accounts for time off, you'll want to use this: [ (Hours per Week x 52) – ( (Public Holidays + PTO Days) x Hours per Day) ]. This simple adjustment gets you significantly closer to the truth of your team's available time.
How Does This Calculation Work For Part-Time Employees?
The process is exactly the same—you just start with their specific contracted hours instead of the full-time 40.
Let's say you have an employee working 20 hours per week. Their baseline calculation is simply 20 x 52 = 1,040 hours. From there, you just subtract their prorated holidays and vacation days to find their actual annual total. The principle holds true no matter the weekly hour count.
Why Should We Bother Tracking Non-Billable Hours?
This is a big one. Tracking non-billable time is absolutely vital for understanding your business's true operational costs. It’s the only way to see how much time is being invested in essential activities that don't directly generate revenue—think admin work, business development calls, internal training, or team meetings.
Without this data, you're flying blind. It helps you price projects more accurately by accounting for the real effort involved, and it’s critical for managing workloads to prevent burnout. Ignoring it is like trying to balance your budget while leaving out half your expenses.
Ready to stop guessing and start knowing? TimeTackle transforms your calendar into a powerful analytics tool, automating time tracking and delivering the insights you need to boost productivity and profitability. Discover a smarter way to manage your time.