It's easy to get lost in a sea of project data. But what if you could look at it like a quick health check-up for your agency? Let's reframe project analysis—not as a mind-numbing chore, but as an essential diagnostic tool you need to survive and grow.
Why Project Analysis Is Your Agency’s Health Check

Think of your agency as a living, breathing thing. Every project is a vital organ, and solid analysis is your stethoscope. It lets you hear what’s really going on under the surface. Without it, you're just flying blind, running your business on gut feelings alone.
This kind of regular check-up shows you which projects are actually profitable, which ones are quietly bleeding you dry, and where your best opportunities are hiding.
Getting to the Root of Agency Pains
For most agency leaders, the biggest headaches come from unreliable data and pure guesswork. We all know manual timesheets are a mess, which leads to completely skewed profitability numbers and a burnt-out team trying to juggle an impossible workload.
Good project analysis cuts through the noise and answers the tough questions with data, not assumptions:
- Profitability: Are we really making money on this client, or is it just a feel-good project?
- Efficiency: Is our team completely swamped, or do we actually have room to take on new business?
- Forecasting: Can we confidently predict what our resource needs will look like next quarter?
This isn't just an internal problem. The industry is facing a massive talent shortage. The global demand for project management professionals is projected to nearly double, jumping from 40 million to 70 million by 2035. This skills gap puts a ton of pressure on mid-sized agencies, often forcing them back into that cycle of guesswork, burnout, and sloppy reporting.
Turning raw data into real insights is what moves you from constantly fighting fires to actually planning for the future. It’s the difference between guessing and knowing.
If you want to get into the weeds of what to measure, check out our guide on essential metrics for project management. Ultimately, a systematic approach is how you build a healthier, more resilient, and—most importantly—more profitable agency.
Key Methods for Analyzing Your Projects
It's one thing to talk about project analysis in theory, but putting it into practice when you're juggling deadlines and client demands is another story. Let's cut through the jargon and look at the core methods from the perspective of a busy project manager trying to make sense of it all.
Think of these not as academic exercises, but as practical tools you can pull out to answer specific, critical questions about your projects. Knowing which one to grab is the first step to getting real clarity.
Gauging Profitability with ROI Analysis
At the end of the day, Return on Investment (ROI) Analysis boils down to a single, crucial question: “Was this project actually worth it?” It forces you to look past the top-line revenue and get honest about every cost involved—especially your team's time, which is your most expensive asset.
Imagine you just wrapped up a big website redesign. The final invoice looked great, but the project was a slog of endless revisions and weekend sprints. An ROI analysis cuts through the noise by pitting the total cost (all those extra hours included) against the revenue. The result is a simple percentage that tells you how profitable that "great" project truly was.
A healthy ROI is your proof that a project was a financial win. A low or negative one is a massive red flag, telling you that your pricing, scoping, or process needs a serious overhaul before you take on another project like it.
This is your go-to method for proving a project’s value to stakeholders and making sharp, data-backed decisions about which clients you should be chasing next.
Balancing Workload with Utilization Analysis
Next up is Utilization Analysis, which is all about your people. This method shines a light on how your team is spending their time, comparing the hours they log on billable, client-facing work against the time spent on non-billable tasks like admin, internal meetings, or business development.
The goal isn't to hit 100% utilization—that's a recipe for burnout, plain and simple. What you're looking for is a healthy, sustainable balance. For most agencies, a sweet spot is somewhere around 75-85%, indicating the team is productive but not constantly running on fumes.
- Low Utilization: This could mean you have spare capacity to take on new work. Or, it might be a warning sign that non-billable creep is eating into your profitability.
- High Utilization: If your team is consistently maxed out, you're flirting with disaster. It’s a leading indicator of burnout, declining quality, and potential turnover.
By keeping an eye on this metric, a manager can see that a designer is overloaded and needs support, or build a rock-solid case for hiring a new developer when the whole team is stretched thin.
Learning from the Past with Post-Mortem Analysis
Finally, the Post-Mortem Analysis is your formal process for learning from every single project—the good, the bad, and the ugly. It's a structured debrief with the whole team after the dust has settled.
This isn't about blame. It's about asking honest questions: What went right? What went wrong? What will we do differently next time? Talking through these points as a team turns individual lessons into institutional knowledge.
Maybe a communication breakdown led to delays, or perhaps a new software tool was a game-changer. Capturing these insights ensures that mistakes aren't repeated and wins are baked into your process for the next project. To get a handle on complex timelines, many teams find it helpful to compare different project management tools; our detailed guide on the differences between Gantt and PERT charts can help you figure out which is right for you.
Choosing the Right Project Analysis Method
This table offers a quick comparison of core analysis methods, helping you select the right tool to answer your agency's most pressing questions about project health and profitability.
| Analysis Method | Primary Goal | Key Question It Answers |
|---|---|---|
| ROI Analysis | Measure financial success | "Did we make a profit on this project?" |
| Utilization Analysis | Optimize team capacity and prevent burnout | "Is our team's time being spent effectively?" |
| Post-Mortem Analysis | Improve future project performance | "What can we learn from what just happened?" |
Ultimately, these methods aren't mutually exclusive. The most successful teams use a combination of them to get a complete, 360-degree view of their operations, ensuring they're not just busy, but profitable and sustainable.
Your Step-By-Step Project Analysis Framework
Knowing the theory is one thing, but the real magic happens when you turn that knowledge into a repeatable process. A solid framework takes project analysis from a "nice-to-have" idea to a source of reliable business intelligence. Think of it less like a rigid checklist and more like building a habit of inquiry that constantly sharpens how you work.
The whole point is to create a simple, repeatable loop: set your goals, gather the data, figure out the story behind the numbers, and then actually do something with what you've learned. This approach ensures you’re not just putting out fires but actively shaping better project outcomes from the start.
This flow breaks down the core pillars of an effective analysis, zooming in on the value delivered, how the team worked together, and what you can learn for next time.
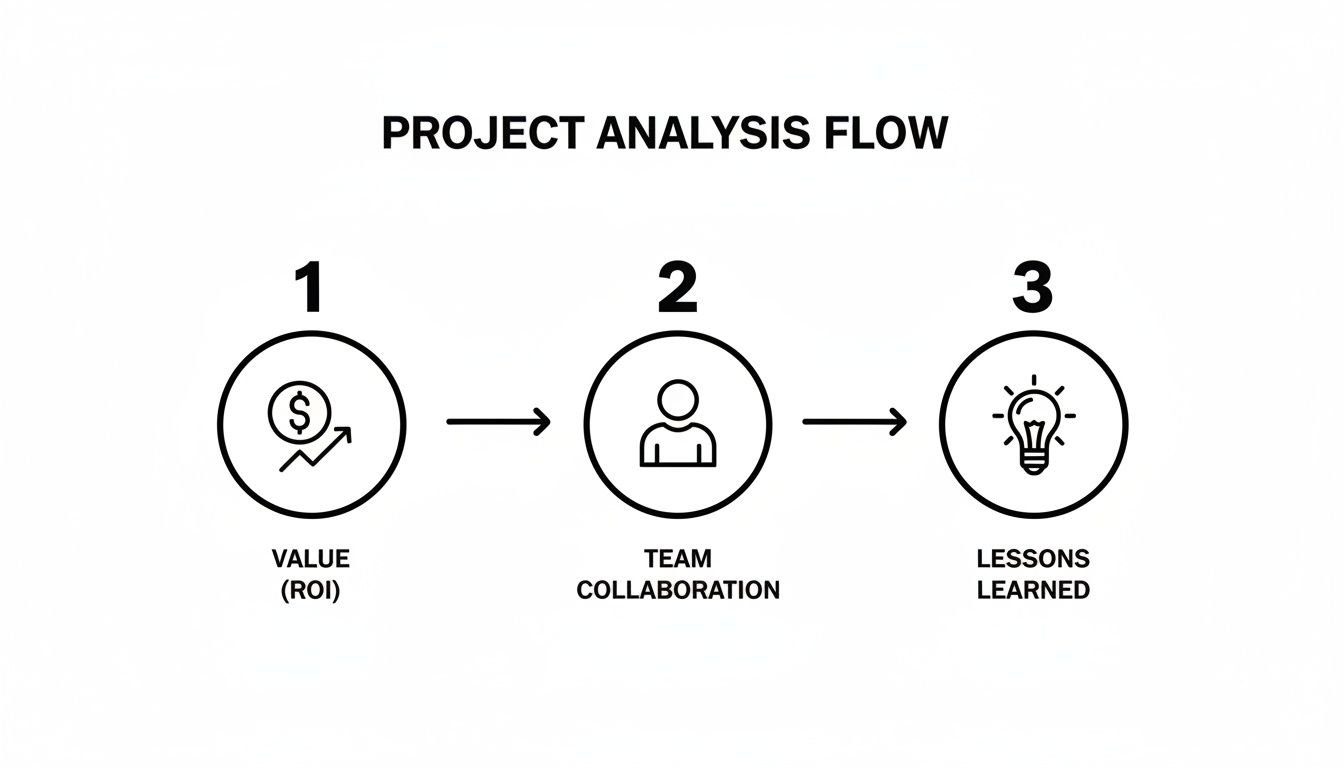
It’s a great reminder that a complete analysis has to look beyond just the financial return. You need to consider your team’s health and build in a way to continuously improve.
1. Define Success with Clear KPIs
Before you can analyze anything, you have to know what you're aiming for. Vague goals like "a successful project" don't cut it. You need to establish concrete Key Performance Indicators (KPIs) that you can actually measure.
For most agencies and service businesses, this usually boils down to three core areas:
- Financial Health: Target a specific Return on Investment (ROI) or aim for a healthy profit margin. For example, a great starting point is aiming for a minimum 25% profit margin on all fixed-bid projects.
- Team Efficiency: Set a resource utilization target. Keeping your team between 70-85% billable is a common goal that ensures everyone is productive without heading toward burnout.
- Client Satisfaction: Keep tabs on scope creep by tracking out-of-scope requests. Or, use a simple Net Promoter Score (NPS) survey after the project wraps to gauge how happy the client was.
These numbers give your analysis a clear destination and tell you if you've arrived.
2. Establish Your Analysis Cadence
Consistency is everything. A one-off analysis gives you a snapshot, but you need the whole movie to see what's really going on. The trick is to establish a regular schedule for reviewing your KPIs.
A practical rhythm might look something like this:
- Weekly Pulse Checks: Just a quick, 15-minute look at budget burn and who’s working on what for all active projects.
- Monthly Deep Dives: A more thorough review of profitability and utilization across the entire project portfolio.
- Post-Project Post-Mortems: This should be non-negotiable. Hold a debrief within one week of project completion to capture lessons while they're still fresh.
This cadence embeds analysis right into your workflow, turning it into a proactive habit instead of a reactive chore. For an even more proactive approach, you can look into techniques like Mastering Project Pre-Mortems with AI, which provides a guide to spotting risks before they become problems.
3. Communicate Insights and Take Action
This is the final—and most important—step. Turning raw data into smart decisions. An insight is completely useless if it just sits in a spreadsheet. Your framework needs a clear process for sharing what you’ve found and assigning action items to the right people.
An analysis is only complete when it leads to a specific action. Whether it’s adjusting a client’s retainer, reallocating a team member, or updating your scoping process, the outcome must be tangible change.
This is how you create a powerful feedback loop. By consistently defining goals, measuring your progress, and acting on the results, you transform project analysis from a simple report into the engine that drives continuous improvement for your whole operation.
Automating Data Capture for Flawless Analysis
Your project analysis is only as good as the data you feed it. Let’s be honest: if you're building your strategy on manual timesheets, you're working with flawed data. It’s not anyone’s fault; it’s just human nature. People forget, they guess, and they round up.
In fact, studies show employees can burn up to 50 hours per year just trying to remember what they worked on. That’s a lot of wasted time creating data that’s unreliable at best. This guesswork makes a true analysis of projects feel more like a shot in the dark.
The only way to win this game is to change the rules. Stop chasing down timesheets and start capturing what’s actually happening. The source of truth is already there: your team's calendar. Whether it's Google or Outlook, it’s a direct, unfiltered record of where time is going.
Turning Your Calendar into a Data Engine
The first step is simply connecting your team's calendars to an analytics platform. This sync instantly turns every scheduled meeting, client call, and focus block into a raw data point. But the real magic happens when you layer automation on top.
Instead of hounding your team to categorize their hours, you can create simple, automated rules. For example, you can set a rule that automatically tags any calendar event with "Project Phoenix" in the title as billable work for that specific client. Just like that, raw events become structured, analysis-ready information—with zero manual effort.
The goal is to make data collection invisible. When time is captured passively from the tools your team already uses every day, the data becomes effortlessly accurate, paving the way for trustworthy analysis.
This shift from manual nagging to automated capture is a game-changer. For a deeper look at this, our guide on how to automate repetitive tasks offers more practical strategies to cut out the busywork.
This is what it looks like in practice. A platform like TimeTackle syncs calendar data and gets it ready for visualization.

Here, you can see raw calendar events flowing seamlessly into an analytics environment, which is the foundation for building dashboards that show you what's really going on with utilization, profitability, and efficiency.
From Raw Events to Powerful Dashboards
Once your data is flowing and tagged automatically, you can build dynamic dashboards that give you answers in seconds. You can finally see the metrics that used to be buried in messy spreadsheets:
- Project Profitability: Is this project on track? Compare the actual time invested against the budget in real-time.
- Team Utilization: Who’s underwater and who has capacity? See billable vs. non-billable hours broken down by team or individual.
- Operational Efficiency: Where is all the time really going? Pinpoint which activities are consuming the most hours across the company.
Of course, automated capture is just one piece of the puzzle. You still need to ensure the information is clean and reliable. For that, check out a practical guide to improving data quality, which covers smart strategies for maintaining accuracy.
When you combine automated capture with good data hygiene, you build a system that delivers insights you can actually trust. No more guessing.
Project Analysis in the Real World

Theory is great, but seeing analysis of projects in the wild is where these concepts really click. While the core principles don't change much from one industry to the next, the specific problems teams are trying to solve can look completely different.
Let's walk through a few real-world scenarios. Each one highlights a common pain point, the analytical method used to figure it out, and the bottom-line business impact. This is how a simple report transforms into a genuine competitive advantage.
Creative Agencies Pricing Retainers with Confidence
Every creative agency knows the feeling: the "all-you-can-eat" retainer that slowly but surely becomes a money pit. One agency was living this nightmare with a major client. The work felt constant and important, but the team was perpetually burned out, and nobody had a clue if the account was actually profitable.
The Problem: The agency had no way of knowing if the fixed monthly fee was even covering the hours poured into the account. All those "quick favors" and endless revision cycles were silently killing their margins.
The Solution: They rolled out a detailed billable vs. non-billable hours analysis. Using calendar-driven data capture, they started tagging every single meeting, design sprint, and client call tied to that retainer. Suddenly, they had a crystal-clear picture of their true time investment.
The Outcome: The data was shocking. The team was spending nearly 40% more time on the account than the retainer covered. Armed with undeniable proof, the agency confidently went back to the client. They renegotiated the contract, shifting to a project-based model with a clear scope. Not only did they save the relationship, but they also boosted the account's profitability by over 25%.
Professional Services Firms Optimizing Consultant Workloads
For consulting firms, consultant utilization is the lifeblood of the business. A mid-sized IT consultancy noticed a troubling pattern: a few star consultants were consistently hitting over 90% utilization and heading for burnout, while others were barely scraping 60%.
The Problem: Projects were being assigned based on who seemed available, not who actually had the capacity. This created a lopsided workload that was frying their top performers and letting other talent sit on the bench.
The Solution: The firm adopted a utilization analysis to get a complete, unbiased view of every consultant's schedule. By tracking billable client hours, internal training, and even sales support activities, they built a real-time dashboard of team capacity.
True visibility isn't about tracking every minute for the sake of it. It's about having the right information to make smart, humane decisions that support both your people and your bottom line.
The Outcome: The data gave managers the clarity they needed to reallocate projects from overloaded consultants to those with bandwidth. It also flagged a need for more focused business development to build a pipeline for the underutilized team members, creating a far more balanced and productive workforce.
Product Teams Aligning Engineering with Strategy
Internal product teams grapple with a different kind of puzzle: ensuring their most valuable resource—engineering time—is actually spent on work that pushes the company forward. At one SaaS company, leadership felt the engineering team was always busy, yet key features on the roadmap kept getting delayed.
The Problem: A major disconnect had formed between the company's strategic goals and the engineering team's day-to-day grind. Unplanned bug fixes, mounting technical debt, and various "shadow projects" were constantly derailing the official product roadmap.
The Solution: The product manager kicked off a project analysis to track engineering hours against specific product initiatives and strategic goals.
The Outcome: The analysis revealed that almost 30% of engineering time was being siphoned off by unplanned work. This single insight ignited a crucial conversation between product and engineering leaders. It led to a new triage process for incoming requests and dedicated "sprints" to pay down technical debt, successfully pulling the team's focus back to the company's core strategy.
Common Questions About Project Analysis
As you start weaving a more structured analysis into your projects, a few practical questions always pop up. It’s one thing to talk about the theory, but making it a real-world process that people actually stick to means solving a few common hurdles. Here are some straight answers to help you build a system that works.
How Often Should We Conduct a Project Analysis?
There's no magic number here. The right frequency depends entirely on your project's rhythm and complexity. Think of it like checking your GPS on a road trip. On a fast-moving highway with constant turns (like a quick agency project), you’re glancing at it all the time. But on a long, straight desert road (a multi-year software build), you check in far less often.
A good rule of thumb is to let the project's natural pace dictate your analysis cadence:
- For fast-paced projects like agency sprints or marketing campaigns, a weekly or bi-weekly "pulse check" is a must. You need to keep a close eye on budget burn and who’s working on what. This is how you catch scope creep or scheduling conflicts before they completely throw you off course.
- For longer-term projects, think software development or new service launches. A detailed monthly analysis, paired with check-ins at major milestones, usually hits the sweet spot. It gives you that high-level strategic view without bogging everyone down in constant reporting.
But no matter what, a post-mortem analysis is non-negotiable. Get the team together within a week of project completion. This ensures the insights are fresh and people are willing to be honest about what went right and what didn't.
What Are the Most Important KPIs to Track?
It’s incredibly easy to get lost in a sea of data and end up with "analysis paralysis." To avoid this, just focus on a handful of metrics that tell you the most critical parts of the story. For most businesses that sell services, these KPIs fall into three main buckets.
By focusing on just a few key metrics for financial health, project progress, and team efficiency, you can get 80% of the insights you need with only 20% of the effort.
Start with one or two from each of these categories:
- Financial Health: These are the numbers that tell you if you're actually making money. The most important ones are the Cost Performance Index (CPI), which shows if you're over or under budget, and Return on Investment (ROI), which measures the project's overall profitability.
- Project Progress: These KPIs tell you if you're on time. Your Schedule Performance Index (SPI) is perfect for monitoring the timeline, while Scope Creep Percentage shows you just how much unplanned work is sneaking into the project.
- Team Efficiency: This is all about how your people are doing. The Resource Utilization Rate is your best indicator of burnout risk, showing if people are overworked. Meanwhile, the Billable Hours Percentage clarifies how much time is truly being spent on work that generates revenue.
How Do We Get Team Buy-In for This New Process?
Let’s be honest: when you introduce a new "analysis process," your team usually hears one of two things: "micromanagement" or "more admin work." To get genuine buy-in, you have to position this as a tool that helps them, not just something for the management spreadsheet.
First, lead with the biggest win: automated data capture means killing off the universally hated manual timesheet. Frame it as a way to free them from tedious admin, not as a way to watch their every move.
Second, connect the dots between analysis and their own well-being. Explain that utilization data isn't about cracking the whip—it's your best defense against burnout. This data gives you the hard evidence needed to justify hiring more people, rebalancing unfair workloads, and saying no to those unprofitable, high-stress projects.
Finally, share the results. Be transparent. When your team sees that these insights lead to better-scoped projects, more manageable workloads, and more successful outcomes for everyone, they’ll stop seeing it as a chore. They'll start to see it for what it is: a tool for building a healthier, more sustainable way to work.
Ready to stop chasing timesheets and get crystal-clear insights from your project data? TimeTackle automates data capture directly from your team’s calendar, giving you the accurate, real-time dashboards you need to measure profitability, utilization, and efficiency without the manual work. See how TimeTackle can transform your project analysis.