A cycle time calculator starts with a simple formula: Net Production Time / Units Produced. If a team has 420 minutes of net production time and finishes 420 parts, cycle time is 1 minute per part. The hard part isn’t the math. It’s applying that same thinking to service work, where the “unit” is a deliverable and timestamps often live in calendars, inboxes, and project tools instead of a factory line.
If you run an agency, this probably feels familiar. A client asks why a website project slipped. Finance wants cleaner billing support. A department lead says the team is overloaded, but nobody can point to the exact phase where work stalls. Then someone exports a few timesheets, everyone debates whether those numbers are real, and the meeting ends with more opinions than answers.
That’s where cycle time helps.
Used well, it gives you a practical way to answer questions that matter to agency managers: How long does a deliverable take? Which phase drags? Where do handoffs go bad? Are your quotes grounded in real delivery data, or in what the team hopes will happen? Most articles on this topic stop at manufacturing examples. That’s fine for a machine shop, but not for a consulting firm or creative team that lives inside Google Calendar, Outlook, Slack, and a CRM.
This guide takes the factory formula and puts it where most service teams already work: the calendar.
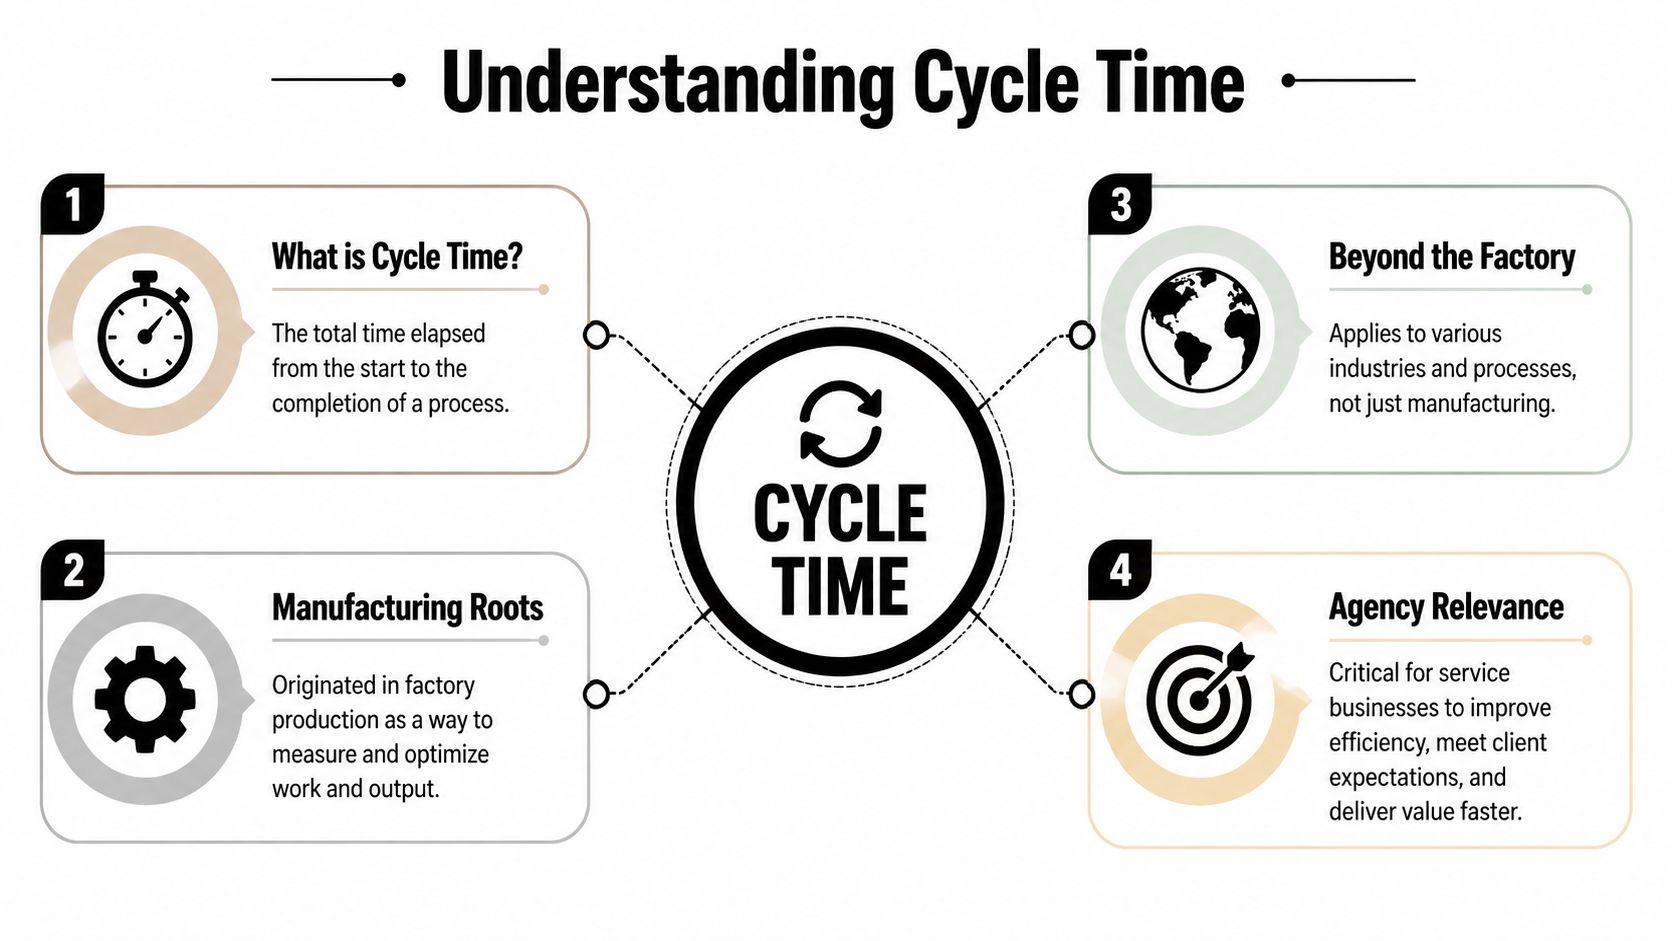
What cycle time is and why it’s not just for factories
The classic definition is simple. In manufacturing, cycle time is Net Production Time divided by Units Produced. A CNC lathe running 420 minutes and producing 420 parts has a cycle time of 1 minute per part, and that standard measure has been widely used since lean manufacturing spread in the 1990s through systems shaped by Toyota thinking, as explained by Caddis Systems’ cycle time calculator reference.
That matters because it gives us a clean starting point. You need a unit. You need a time window. You divide one by the other.
The service version of the same idea
Agencies don’t produce bolts or doors. They produce campaign briefs, landing pages, onboarding plans, audits, proposals, reports, and client approvals. So the formula shifts from “minutes per part” to something more like:
- Tagged work time / completed deliverables
- Start of active work to end of active work
- Phase time / output for that phase
The concept stays the same. The unit changes.
For service work, the cleanest working definition is this: cycle time is the time from active work started to active work finished for a deliverable or phase. That’s different from total waiting time before someone starts, and it’s different from the client’s full wait from request to delivery.
Cycle time is not lead time
Agency teams mix these up all the time, and that creates bad reporting.
A simple analogy helps. Think about ordering a pizza. You place the order at 6:00. The kitchen starts making it at 6:20. The pizza is ready at 6:40. You receive it at 7:00.
- Lead time is 6:00 to 7:00
- Cycle time is 6:20 to 6:40
That same split works for agencies.
If a client requests a report on Monday, your analyst starts work on Tuesday, pauses for stakeholder feedback, finishes on Wednesday afternoon, and the account manager sends it Thursday morning, your client experienced lead time. Your operations team should usually inspect cycle time first, because that’s where process waste and billing distortion often hide.
Practical rule: If you want to improve delivery speed, separate queue time from work time first. Otherwise, you’ll argue about capacity when the real issue is waiting.
Why agency managers should care
Cycle time gives you a common language across delivery, finance, and ops. It helps with:
- Billing support because you can compare active work against what was delivered
- Scoping discipline because similar work should show similar ranges over time
- Bottleneck diagnosis because phases can be measured separately
- Capacity planning because you stop relying only on gut feel
For a deeper explanation of the term itself in a work context, this guide on cycle time meaning is a useful companion.
The biggest shift is mental, not technical. You stop asking, “How busy is the team?” and start asking, “How long does this type of work take when we do it?”
Your interactive cycle time calculator
Here’s a basic way to use a cycle time calculator for service work.
Enter:
- Task start date and time
- Task end date and time
- Number of deliverables completed
Then calculate the elapsed work period and divide by completed deliverables if you finished more than one item in that window.
If one strategist starts a client audit at 9:00 AM and wraps it at 1:00 PM, and that block produced one finished audit, the cycle time is the active duration for that deliverable. If the same block produced two finished deliverables, divide the total tagged time by two.
What to include and what to leave out
This part is where most agency tracking goes wrong. Don’t dump every calendar item into the calculator and call it done. Define your rules first.
Use these inputs:
- Include active work such as writing, reviewing, building, editing, QA, or client-facing delivery work tied to the deliverable.
- Exclude unrelated admin such as general internal meetings, recruiting interviews, or company-wide updates.
- Count finished units consistently so one “deliverable” means the same thing every time.
- Keep the start and end rules stable across the team, otherwise your numbers won’t compare.
A calculator is only as good as the timestamps you feed it. Bad definitions create fake precision.
Start simple
For a first pass, use the calculator on one recurring deliverable:
- weekly client report
- proposal draft
- landing page update
- onboarding plan
That gives you a baseline without turning this into a process overhaul. For more complex work, especially projects with many handoffs, you’ll get better insight by breaking the project into phases instead of forcing one giant average.
How to calculate cycle time with step-by-step examples
Agency work gets easier to measure when you stop treating the whole project as one blob. Manufacturing solved this long ago by breaking work into blocks. In a patented machining estimator, systems decode commands into blocks and segments so teams can compute travel time at a granular level. That same segmented logic can be adapted to services, and it often reveals that 20% of the phases consume 60% of the total cycle time, as described in the TREA cycle time estimator patent summary.
That idea fits agencies perfectly. Don’t just measure “website project.” Measure discovery, design, development, QA, revision, and launch prep.

Example one: a client website build
A mid-sized agency is building a website for a new client. The delivery lead wants to know why these projects feel unpredictable.
So instead of measuring one giant start-to-finish span, the team breaks the project into blocks:
| Phase | Start | End | Output |
|---|---|---|---|
| Design | first active design session | approved design handoff | design package |
| Development | first build session | code complete for QA | working build |
| QA and fixes | first QA session | launch-ready approval | tested site |
The math itself is plain. For each phase:
Cycle time = active work time in that phase / units completed in that phase
If the design team logs active calendar-tagged work across several sessions and produces one approved design package, that total active time is the design cycle time for one unit. Do the same for development and QA.
What usually happens? One phase blows up the average. Sometimes QA is not the problem. The main delay sits in design revisions, scattered feedback calls, or a handoff that keeps bouncing between account and creative.
That’s the value of segmentation. You stop blaming “the project” and start seeing where the time went.
Example two: weekly performance reports
Recurring work is easier because the unit is stable. Say your agency produces one performance report per client every week.
You can track each report like this:
- start when the analyst begins pulling data
- include drafting, commentary, review, and client-ready formatting
- end when the report is ready to send
- count each finished report as one unit
After a few weeks, you’ll have a list of report cycle times. Then you can compare them.
Maybe one client’s reports always take longer because the source data comes in messy. Maybe one team lead adds too many revision rounds. Maybe reports due on Mondays drag because the prep work gets split across too many people on Friday.
“If the same deliverable keeps taking wildly different amounts of time, don’t start with staffing. Start with process consistency.”
A simple way to break work down
Use this model for service projects:
- Project level for client-facing estimates and postmortems
- Phase level for bottleneck detection
- Task level for coaching and process cleanup
- Recurring deliverable level for budgeting and staffing decisions
This is what works in practice. Big top-line averages help with reporting, but the useful fixes usually show up one layer lower.
The problem with manual tracking and how to automate it
Monday morning, a client asks why onboarding took three weeks. Finance wants a number they can trust for pricing. Delivery wants to know where the delay happened. Then the scramble starts. Someone pulls timesheets, someone else checks Slack for the handoff, and a project manager searches email to figure out when the deck was finished. By then, you are not measuring cycle time. You are reconstructing it.
That is the main problem with service work. The evidence exists, but it is spread across calendars, meetings, inboxes, chats, and late timesheet entries.
![]()
Why manual entry breaks down
Most cycle time calculators were built for manufacturing. They assume work starts cleanly, moves through a visible process, and ends at a clear completion point. Agencies do not work that way. Work often starts in fragments, pauses for feedback, and finishes in stages.
Manual entry fails for a few predictable reasons:
- Start times are fuzzy because assignment date is rarely the same as actual work start
- End times drift because "done" might mean drafted, approved, sent, or invoiced
- Meeting work disappears because prep, review, and follow-up rarely get logged consistently
- Timesheets are backfilled later so the record reflects memory, not behavior
Those gaps create bad management decisions. A team can look slow on paper when the actual issue is waiting. Or a client can look unprofitable because half the work happened in unlogged review time.
Why the calendar is the better source
For agencies and service firms, the calendar is usually the closest thing to an operating record. It shows when people reviewed, presented, met with clients, blocked production time, and handled revisions. That matters because service cycle time is often hidden inside coordination work, not just execution work.
This is also where agencies have an advantage over factory-style tracking. Your team already lives in the calendar. If you use it as the base record, you can estimate active work far more accurately than with end-of-week timesheets.
If your team runs on Google Workspace, this guide to time tracking with Google Calendar shows how to set up a calendar-based workflow without asking people to maintain a second system.
Field note: Teams usually resist timesheets for the same reason cycle time data turns unreliable. People remember what they planned to do. Calendars capture what they actually scheduled and attended.
Where automation helps, and where it does not
Automation improves the raw material. It can pull events from Google or Outlook, apply rules, tag work by client or project, and keep timestamps consistent enough to calculate cycle time without chasing entries across five systems.
TimeTackle is one example. It connects calendars and CRMs, applies tags and rules, and gives teams a cleaner event history to analyze by project, client, or opportunity. For cycle time, that means less manual reconstruction and fewer arguments about what happened when.
There is still a trade-off. Automation can clean up collection, but it cannot define your process for you. If one account manager says a job is done at internal approval and another says it is done when the client receives it, the software will scale the confusion.
Set the rules first. Then automate the capture. That order is what makes the numbers usable for billing, staffing, and bottleneck analysis.
Using cycle time data to find and fix bottlenecks
Once you have enough data, the job changes from calculation to diagnosis.
A single cycle time number can be useful for a postmortem, but patterns matter more. You want to know whether your process is stable, whether one phase keeps slipping, and whether your team can meet demand without burning margin.
Compare cycle time to demand
In operations, teams compare cycle time against takt time, which is available production time divided by customer demand. The principle works in agencies too. If your average time to produce a deliverable is slower than the pace clients require, you have a capacity problem, a process problem, or both.
The useful move is not to panic and ask everyone to work faster. It’s to locate where the mismatch starts.
For example, if proposal reviews always bunch up at the end of the week, your delivery pace may look fine at first glance, but your workflow still misses the demand rhythm because approvals pile up in one phase.
Look for variation, not just averages
Averages can hide chaos. That’s why process analysis usually starts with a minimum of 30 cycle time observations and calculates variability, including the coefficient of variation, where CV >1.0 signals high variability. For agencies, a rolling 30-90 day view can steady trend analysis, and one service example used for planning is 53 hours for software story completion, according to MetricGate’s cycle time analysis guide.
That gives agency managers a practical test.
If your report-writing average looks acceptable but the spread is wide, you still have a reliability issue. Clients don’t experience averages. They experience the late outliers.
Healthy operations are not just fast. They are predictable enough that managers can quote, staff, and schedule with some confidence.
A simple bottleneck review
Use a recurring review with these checks:
- By phase: Which stage has the longest active cycle time?
- By client type: Do certain accounts create more rework or approval delay?
- By team: Is one pod consistently slower on the same deliverable?
- By deliverable type: Which work product has the widest spread between shortest and longest completion time?
- By handoff: Where does work stall between one owner and the next?
You don’t need advanced statistics to get value. A phase-level comparison often surfaces the problem fast.
What to do when you find the issue
Different bottlenecks need different fixes.
| Pattern | Likely issue | Better response |
|---|---|---|
| Long design phase | unclear brief or revision loops | tighten intake and approval rules |
| Slow QA | late defect discovery | move checks earlier in the process |
| High variation in reports | analyst-by-analyst inconsistency | standardize templates and review steps |
| Delays before delivery | account handoff lag | define who sends, approves, and closes |
What doesn’t work is treating every delay as a staffing shortage. In agency settings, the first fix is often cleaner intake, fewer handoffs, or a stricter definition of done.
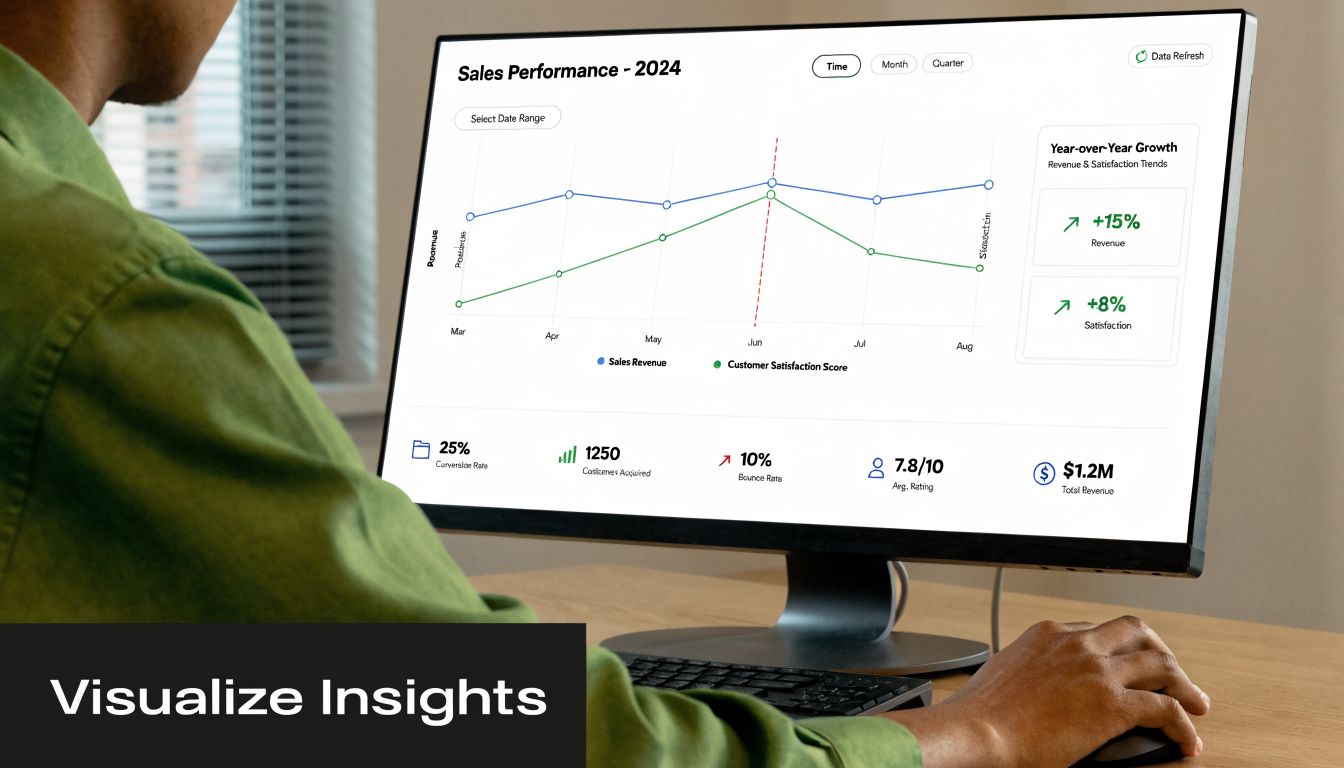
Reporting and visualizing cycle time for your agency
Cycle time reports earn their keep when they help a manager make a decision fast. An agency COO should be able to scan one view and answer three questions. Are delivery times getting less predictable? Where is work slowing down? Which accounts are draining margin through hidden effort?
For service firms, the useful view looks different from a factory dashboard. The goal is not machine output. It is a clear read on how work moves across calendars, handoffs, approvals, and client-facing deadlines.
What to put on the dashboard
A useful cycle time view usually includes:
- Trend line by deliverable type so you can see whether reports, proposals, or onboarding plans are getting faster or slower
- Phase comparison so handoff-heavy work does not disappear inside one project average
- Variation view so leaders can spot unstable processes, not just slower ones
- Client or team filters so account complexity and staffing patterns stay separate
If you’re building operational reporting from shared offices or distributed teams, the broader workplace setup matters too. Teams dealing with hybrid delivery and support functions can pick up practical ideas from guides on BPO workspace solutions, especially when reporting needs cross team, location, and service line boundaries.
Keep the review tight
A weekly or monthly ops review should answer a short list of questions. If the report cannot support these decisions, it is probably too noisy.
| Question | Why it matters |
|---|---|
| Which deliverables slowed down? | protects forecasting and client commitments |
| Which phase is dragging? | points to a process fix |
| Which team has unstable variation? | flags training or workflow inconsistency |
| Which accounts consume hidden effort? | improves pricing and staffing decisions |
Good presentation helps. Clear labels, consistent scales, and restrained chart choices beat overloaded dashboards every time. A spreadsheet can handle this well, especially if your source data is clean. Google Sheets is enough for many agencies.
What matters is consistency. Review the same views on the same cadence, and tie them to staffing, pricing, scoping, and delivery decisions.
If your team already lives in Google or Outlook calendars, TimeTackle turns calendar activity into cycle time data without chasing manual timesheets. That gives agencies a practical way to measure how long work takes from scheduled activity, then compare projects, clients, and teams without rebuilding the story from memory at the end of the month.