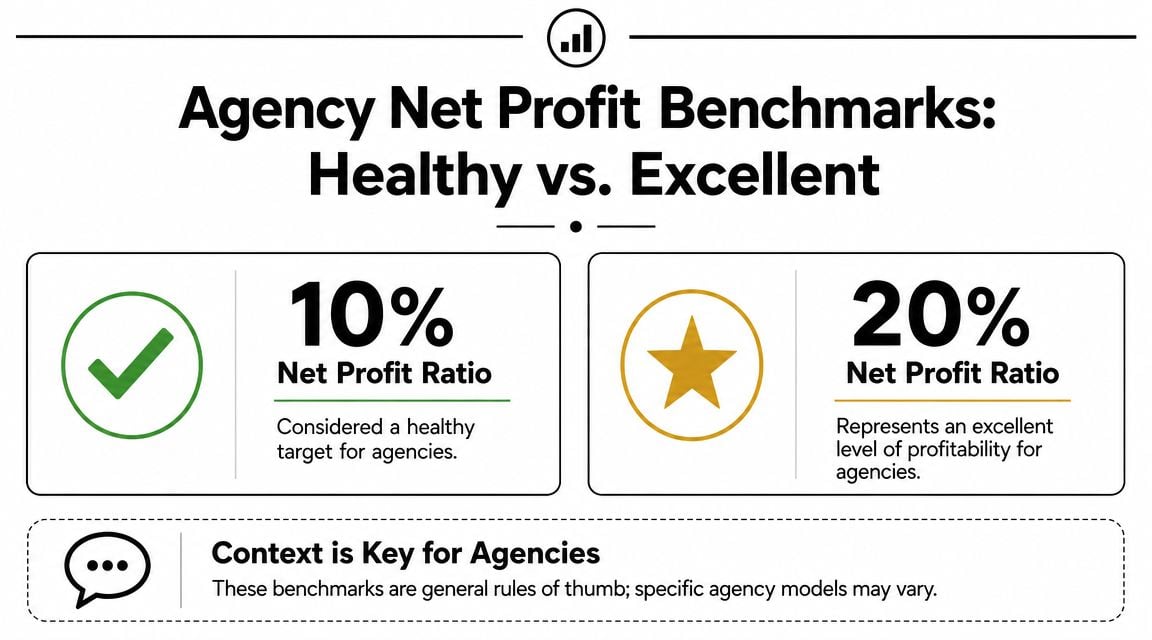
A 10% net profit ratio is a common benchmark for “healthy,” and 20% or higher is often treated as very healthy or strong. For agencies, though, that answer only gets you halfway there, because your real margin health depends less on a generic benchmark and more on how well you manage utilization, pricing, and operational drag.
If you run a mid-sized agency, you've probably had this moment. The month closes, finance sends over the P&L, and you scroll straight to the bottom. Net profit is positive, so nobody panics. But then the key question lands. Is this good, or did we work very hard just to keep a thin slice of what we billed?
That's where a lot of agency teams get stuck. Generic finance advice says one thing, but agency economics work differently. A retailer can live with thin margins because the model is built around volume. An agency usually can't. When your biggest cost is people, a small drop in billable time or a little too much unscoped work shows up fast in net profit.
Project managers matter here more than they often realize. Net profit isn't just a finance metric. It's the final result of staffing choices, scope control, handoff quality, meeting load, write-offs, delivery speed, and whether hours turn into invoices.
That number at the bottom of your P&L what does it mean
You close the quarter. Revenue looks decent. A few big clients renewed. Nobody quit unexpectedly. Then you open the P&L, scroll past payroll, software, contractors, rent, taxes, and all the rest, and land on the last line.
Net profit.
Positive feels good. Unclear feels worse.
Why agency leaders misread it
A lot of teams treat the bottom line like a score without asking what created it. That's a mistake. Net profit is the amount left after all expenses, which means it tells you whether the business model is working, not just whether sales came in.
If you want a quick refresher on how profit and loss statements differ from balance sheets, Allied Tax Advisors has a useful explainer on essential financial insights for businesses. That distinction matters because agencies often look at cash, revenue, and profit as if they all tell the same story. They don't.
A healthy net profit ratio tells you the agency is converting work into retained earnings after delivery costs, admin overhead, interest, and taxes. A weak one tells you revenue is leaking somewhere. Usually in the places operators already know are messy.
Net profit is the scoreboard. Operations decide the score long before finance closes the books.
What project managers should hear in that number
Project managers don't need to become accountants, but they do need to connect delivery habits to margin. A team can hit deadlines and still damage profit if the work took too many unbilled hours, if senior people sat in low-value meetings, or if projects needed rework because the scope was loose from day one.
That's why I like to pair financial review with a harder operational question. Are we running the work cleanly enough that the margin at the bottom makes sense? If you want a practical operating lens for that, this guide to operational efficiency is worth reading.
Here's the plain version. Good net profit means your agency isn't just busy. It means the business kept enough after all the friction of doing the work.
Calculating your net profit ratio in two simple steps
A project wraps, the client pays on time, and the month looks strong on the top line. Then finance closes the books and the profit left over feels thin. That gap usually comes from three places agencies can control: too many delivery hours for the fee, weak pricing on the work sold, or overhead that grew faster than revenue.
The formula is easy. The value comes from reading it like an operator.
Fathom's overview of profitability ratios is useful here because it frames net profit ratio as the result of several inputs, not a standalone score. For agencies, that matters. A low ratio rarely starts in accounting. It starts with underused capacity, scope that was priced too loosely, or admin drag that keeps creeping up while delivery teams stay busy.
Step one is calculate net profit
Start with total revenue, then subtract every expense tied to running the agency.
Include direct delivery costs such as salaries for billable staff, freelance support, and contractor spend. Include operating expenses too: admin salaries, software, rent, finance tools, insurance, interest, and taxes. The number left over is net profit.
Revenue works like the total fees invoiced for the work. Net profit is what the agency kept after paying for the effort, the infrastructure, and the cost of keeping the business running.
If that leftover number seems smaller than expected, compare it with your agency revenue per employee benchmark. It helps explain whether the problem is weak production economics, too much non-billable time, or simple overstaffing for the amount of revenue coming in.
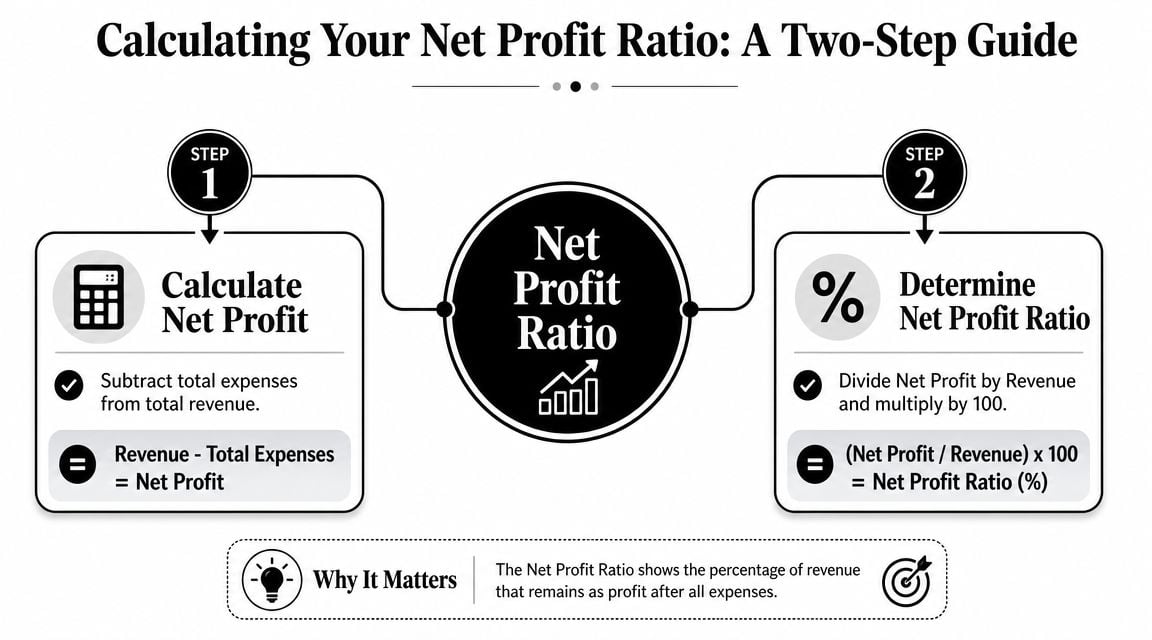
Step two is turn it into a ratio
Use this formula:
Net profit ÷ revenue × 100
That percentage shows how much of each dollar of revenue the agency kept after all costs.
Example: if the agency brought in $500,000 and kept $50,000 after every expense, the net profit ratio is 10%. That sounds simple because it is. The harder part is making sure the inputs are clean and useful enough to guide decisions.
Where agencies usually get the calculation wrong
The mistake is rarely in the formula. It is usually in the setup.
Common problems include:
- treating gross profit like final profit
- reviewing operating profit without accounting for interest and taxes
- counting booked revenue without checking write-offs, discounts, or delayed invoices
- waiting until month-end to look at net profit, after the over-servicing already happened
- burying administrative costs in broad categories that hide operational drag
For agency leaders, this ratio should do more than close the month. It should point back to the core drivers. Are billable teams fully used? Are projects priced to cover the actual hours required? Is overhead helping delivery, or just slowing it down?
Calculate the ratio cleanly, then use it to pressure-test utilization, pricing, and admin load. That is how net profit ratio becomes a management tool instead of a postmortem.
Agency benchmarks what separates good from great
A 10% net profit ratio can mean two very different things inside an agency. One shop hits 10% because pricing is disciplined, teams are well used, and overhead stays tight. Another gets to the same number after a strong quarter, while underbilling, write-offs, and admin drag are already building underneath.
That is why broad benchmarks help, but only to a point.
Generic benchmarks give you range, not diagnosis
Across business advice, the usual rule of thumb is familiar. Under 5% is thin. Around 10% is healthy. Around 20% or more is strong.
For an agency, those ranges only become useful after you ask three operating questions:
- Is billable talent being used well?
- Are projects priced to cover real delivery hours?
- Is overhead supporting delivery, or slowing it down?
A margin band without that context is just a label. Agency leaders need to know what is creating the number.
Why agencies should read the benchmark through an operating lens
Industry comparisons can mislead fast. NYU Stern's sector margin data shows wide differences in net margins across sectors, which is exactly why an agency should not compare itself to the full market and call it a day.
A labor-heavy service business lives or dies on conversion of time into revenue. If utilization slips, if pricing does not match scope, or if admin payroll grows faster than billable output, net profit gets squeezed quickly.
I treat low single-digit net profit as a warning sign. It usually means the agency has very little room for rework, delayed invoices, bad estimates, or one client changing direction mid-project.
What good looks like in agency terms
Here is the practical way to read the ratio inside an agency:
| Net profit ratio | What it usually suggests in an agency |
|---|---|
| Below 5% | The model is fragile. A mix of low utilization, underpriced work, scope creep, or excess overhead is usually pulling profit down. |
| Around 10% | The agency is keeping a reasonable share of revenue, but the next question is whether that margin holds up month after month. |
| Around 12% to 15% | Often a sign of stronger operating control. Teams are usually scheduled better, projects are priced with more discipline, and admin costs are not crowding out profit. |
| 20% or higher | Strong bottom-line performance. This often points to clear positioning, pricing power, efficient delivery, and limited operational drag. |
The jump from good to great rarely comes from cutting coffee, software seats, or office snacks. It usually comes from larger levers. Better utilization on the delivery team. Tighter scoping before work starts. Pricing that reflects actual effort instead of hopeful estimates. Less admin work that adds process but not value.
That is the main use of a benchmark. It helps agency leaders judge whether the current margin reflects a healthy operating model or a number that looks acceptable while the business is leaking profit underneath.
A sample net profit calculation for a mid-sized agency
Abstract percentages are useful, but most operators understand margin better when they can see the P&L mechanics. So here's a fictional agency example.
I'm keeping this qualitative on purpose. The point isn't the exact money values. The point is how a healthy-looking top line can thin out as delivery and overhead take their share.
Sample agency P&L
| Line Item | Amount | Notes |
|---|---|---|
| Revenue | [Insert annual agency revenue] | Total billed client work collected or recognized |
| Direct labor | [Insert amount] | Salaries and benefits tied to delivery staff |
| Contractor costs | [Insert amount] | Freelancers, specialists, white-label partners |
| Gross profit | [Calculated remainder] | What's left after direct delivery costs |
| Admin and operations payroll | [Insert amount] | Finance, HR, operations, support roles |
| Software and tools | [Insert amount] | PM tools, reporting tools, creative tools, CRM |
| Sales and marketing | [Insert amount] | Internal growth costs |
| Office and general overhead | [Insert amount] | Rent, insurance, legal, misc. overhead |
| Operating profit | [Calculated remainder] | Profit before interest and taxes |
| Interest and taxes | [Insert amount] | Final non-operating deductions |
| Net profit | [Calculated remainder] | Final earnings after all costs |
| Net profit ratio | [Net profit ÷ revenue × 100] | Bottom-line percentage retained |
How to read this as an operator
Revenue can look strong while net profit stays weak for very ordinary reasons:
- Direct labor ran hot because too many senior people did delivery work that wasn't priced correctly
- Contractor spend climbed because staffing moved too late and urgent work got patched with expensive external help
- Admin payroll expanded because reporting, approvals, and coordination became more manual as the agency grew
- Software costs piled up because every department bought its own tool without retiring the old one
This is why project managers should care about revenue per employee benchmarks. That metric won't replace net profit ratio, but it helps you see whether headcount is pulling its weight before the final P&L line tells you something is off.
What this example usually reveals
A lot of agencies don't have a revenue problem. They have a conversion problem.
They sell work, but too much of that work gets diluted on the way to net profit. Some dilution is normal. All businesses have it. The warning sign is when every month feels busy, clients seem active, and profit still looks thin.
If the work pipeline is full and net profit is weak, the agency usually isn't charging enough, staffing well enough, or controlling overhead well enough.
Common pitfalls that silently kill agency profit
Most margin damage doesn't arrive as one dramatic event. It shows up as a pile of small operational decisions that nobody owns end to end.
Revenue-based guides often make this harder by giving broad rules of thumb without agency nuance. Revenued points out that many articles mix up net profit margin with gross or operating margin, which leads owners to think a healthy top-line margin means the business is healthy overall in its piece on what is a good profit margin.
Scope creep hides inside “client service”
Project teams often absorb extra rounds, small add-ons, and fast-turn requests because saying yes feels easier than renegotiating. The problem is that clients buy outputs, while agencies pay for time.
A little extra work here and there looks harmless inside one account. Across a full portfolio, it drags delivery margins down and pushes net profit lower without ever appearing as a dramatic cost spike.
Low utilization doesn't look expensive until payroll hits
Unused capacity rarely announces itself. It looks like internal meetings, fragmented calendars, slow approvals, status reporting, context switching, and senior people doing work that should have moved faster through the system.
None of those items scream “profit problem” on their own. Together, they turn salary cost into non-billable time.
Underpricing starts before the project kickoff
Some agencies think they have a utilization issue when they really have a pricing issue. If the original estimate assumed perfect delivery conditions, no revision churn, and no client delays, the project was probably underpriced before anyone logged the first hour.
Watch for these signs:
- Estimates depend on best-case behavior from the client and internal team
- Senior review time isn't priced in even though it always happens
- Change requests stay informal and never reach a commercial discussion
- Teams celebrate sold work before checking whether the work was sold profitably
Administrative drag eats margin from the side
This one gets ignored because it doesn't sit inside client delivery. Manual timesheets, duplicate project updates, spreadsheet reporting, disconnected tools, and approval chains all absorb paid hours.
Nobody notices because the work feels necessary. Some of it is. But a surprising share of admin effort exists only because the system is clunky.
If your agency's margin is weak, don't ask only, “Are we selling enough?” Ask, “How much paid time are we spending just to explain what happened?”
Four actionable strategies to improve your net profit ratio
Once you know what's hurting margin, you need fixes that change behavior, not just reporting. The best moves are usually boring, which is why they work.
BDC makes a point that agency leaders should take seriously: a lower short-term net margin can be acceptable if investment in automation and better time tracking improves billable realization, reduces non-billable time, and creates a better earnings base later, as discussed in its glossary entry on the net profit margin ratio.
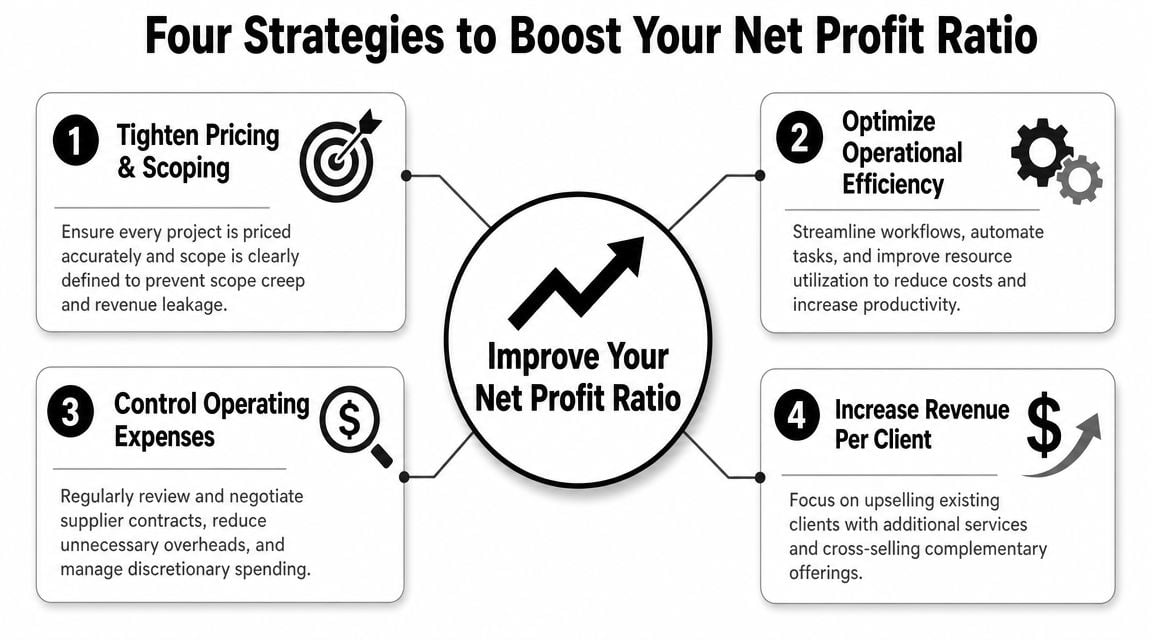
Tighten pricing and scoping before work starts
Most profit problems begin in the proposal, not the postmortem.
Price for the work that happens. Include revision cycles, stakeholder management, handoff time, and senior oversight. If your team always touches a project in certain ways, that effort belongs in the commercial model.
Treat utilization as a management habit
You don't improve utilization by telling people to fill out timesheets better. You improve it by reducing the friction around time capture, spotting capacity gaps early, and cutting the non-client work that senior staff drift into.
A useful way to view it is:
- Good utilization management asks where time went
- Better utilization management asks why valuable people spent time there in the first place
- Best utilization management changes scheduling, staffing, and meeting load before the waste repeats
- Mature utilization management links those patterns back to pricing and account health
If you're working on this from an operations angle, this piece on increasing profitability gives a practical next step.
The cleanest profit gains often come from fixing wasted time, because you don't need more sales to keep more of the revenue you already have.
Cut overhead with intent, not panic
Don't run random cost-cutting drills. Review overhead line by line and ask whether each cost helps delivery, sales, or decision-making.
For teams looking at automation and workflow cleanup, NILG.AI has a thoughtful piece on ways to reduce operational costs. The useful mindset here is selective removal. Keep the systems that reduce billing leakage and admin time. Cut the ones that only create another layer of reporting.
Build faster feedback loops
Quarterly margin reviews are too slow for agencies. By the time the P&L tells you a project mix was weak or utilization slipped, the hours are gone.
What works better is regular visibility into:
- Project profitability trends
- Utilization by team or role
- Write-offs and unbilled work
- Contractor dependence
- Admin load that keeps showing up across departments
That kind of reporting won't fix margin by itself, but it gives project and ops leaders a chance to act while the work is still in motion.
Frequently asked questions about profit ratios
Is net profit ratio the same as gross margin
No. Gross margin shows what is left after direct delivery costs. Net profit ratio shows what is left after every cost on the way to the bottom line, including overhead, interest, and taxes.
For agencies, that gap is where a lot of confusion starts. A team can post healthy project margins and still end the month with weak net profit because utilization slipped, pricing was too soft, or admin work kept senior people off client delivery.
Is a good margin different for agencies than for retail
Yes. The business model changes the answer.
Retail often runs on thinner margins because volume does more of the work. Agencies usually need more room because revenue depends on billable time, pricing discipline, and how much operational drag sits on top of delivery. If an agency is sitting in the low single digits, I would not treat that as automatically normal. I would check utilization, write-offs, discounting, and overhead before accepting it as a market reality.
Should a growing agency accept a lower margin for a while
Sometimes. The key question is whether the lower margin is buying a real improvement.
A temporary dip can make sense if the agency is fixing time capture, tightening project reporting, hiring delivery leadership, or replacing manual admin work with a better operating system. Those costs can pay back later through better utilization and fewer write-offs.
What does not work is labeling every bad quarter as an investment phase. If pricing is still inconsistent, scopes still drift, and account teams are still drowning in internal process six months later, that is not investment. That is unresolved operating drag.
What should project managers watch first
Start with the drivers, not the final percentage.
I'd watch:
- Utilization quality, especially whether senior time is billable and planned well
- Scope control on live work before small overruns become write-offs
- Pricing realism at the point of sale
- Admin load that pulls expensive people into internal coordination instead of client delivery
Project managers influence profit earlier than is widely recognized. They usually see the warning signs before finance does.
If your agency is tired of chasing timesheets, rebuilding reports by hand, and guessing where billable time is really going, TimeTackle is worth a look. It helps teams capture calendar-based work automatically, track utilization with less friction, and surface the operational patterns that shape margin before they hit the bottom of the P&L.