A lot of agency decisions get sold internally with loose language.
“We’ll save time.”
“This tool will clean up reporting.”
“This new service line should be profitable.”
“This hire will pay for itself.”
Sometimes that’s true. Sometimes it isn’t. The problem is that “should” isn’t a decision tool.
If you run delivery, finance, or operations in a services business, you need a way to turn those claims into something testable. That’s where accounting rate return helps. It won’t replace deeper financial analysis, and it shouldn’t. But it gives project managers, team leads, and department heads a simple way to ask a better question: “For the money we put in, how much accounting profit do we expect to get back each year?”
That question is useful far beyond factory equipment or textbook finance examples. Agencies can use it to judge software purchases, process changes, reporting systems, internal automation work, new hires tied to new offers, and even whether a new line of service deserves real budget.
What is the accounting rate of return (and why should you care)

The accounting rate of return, usually shortened to ARR, is a basic way to measure how profitable an investment looks using accounting profit.
The formula is simple. You divide average annual profit by average investment.
That gives you a percentage, which makes the result easy to compare across options. If one initiative produces a higher ARR than another, it looks better on this measure.
Why operators care about it
In an agency, most decisions don’t need a wall of finance jargon. They need a number people can understand and discuss fast.
If a department head wants new software, ARR helps frame the request in business terms. If a delivery lead wants to add a service line, ARR gives finance and operations a common language. If your leadership team keeps making spend decisions on gut feel, ARR gives you a cleaner first pass.
Practical rule: If a manager can’t explain the expected profit and the investment required, the proposal isn’t ready for approval.
This is also why ARR sticks around. According to Corporate Finance Institute, over 50% of large firms use ARR for project appraisal due to its simplicity, and their example shows that a $420,000 investment producing $150,000 in average annual profit yields an ARR of 71.43%. You can review that example in CFI’s guide to the Accounting Rate of Return.
A plain-English way to think about it
Think of ARR as answering this question:
“How many cents of accounting profit do we earn each year for each dollar tied up in this investment?”
That’s easier for non-finance people to hold onto than a spreadsheet full of discounted cash flow assumptions.
If an ARR is 7%, that means 7 cents earned per dollar yearly. If an initiative is expected to generate a stronger percentage than your internal hurdle, it moves closer to approval. If it falls short, it needs a better case or a smaller scope.
Where it fits in agency life
ARR is useful when you already have these ingredients:
- A defined investment such as software, setup work, a rollout, or a service launch
- A reasonable estimate of annual profit based on new revenue, cost savings, or both
- A useful life for the investment, so you can spread the impact over time
- A need for speed because not every decision needs a full finance model
ARR isn’t trying to be perfect. It’s trying to be useful.
That matters in agencies because many decisions sit in the messy middle. They’re too important for hand-waving, but too routine for a full investment committee process. ARR gives you a practical middle ground.
How to calculate ARR with a step-by-step formula
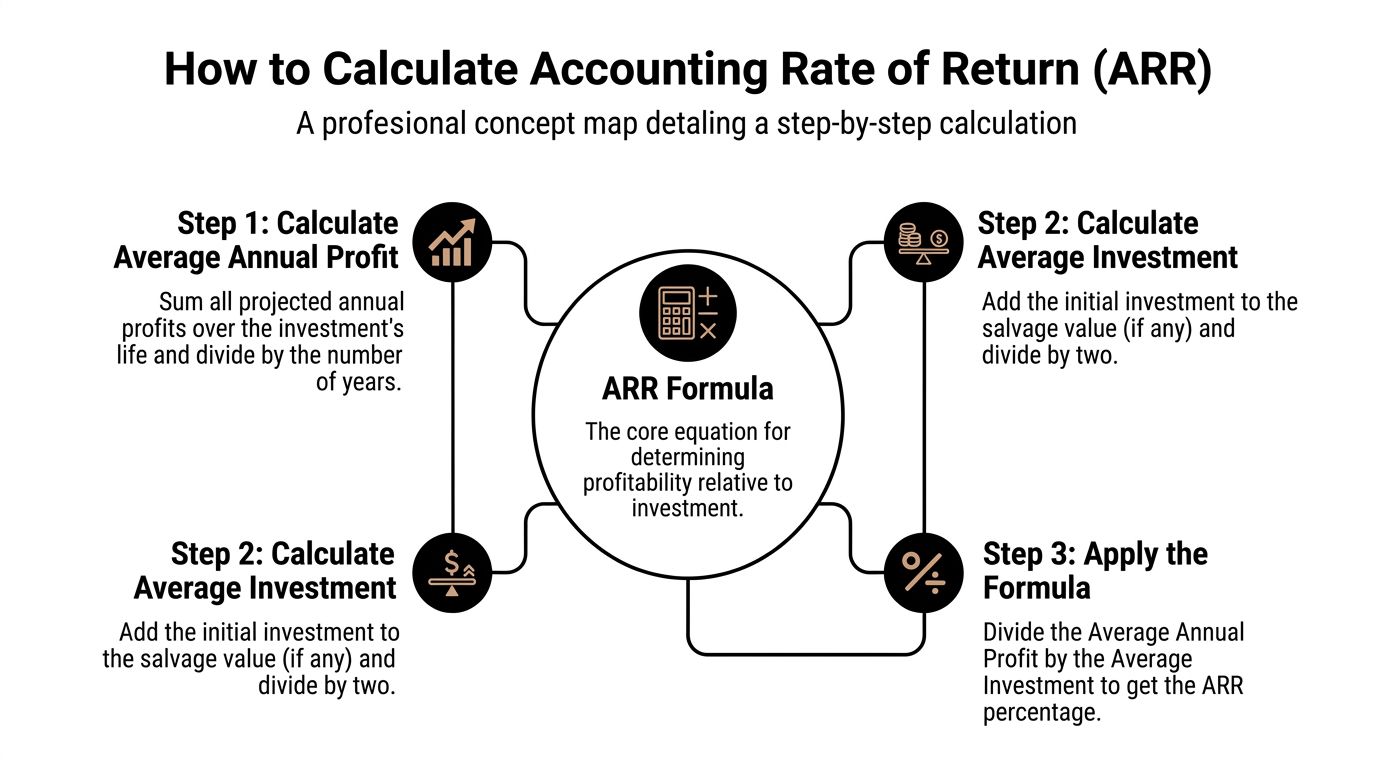
The formula looks simple on paper:
ARR = Average annual profit / Average investment
What trips people up isn’t the division. It’s deciding what belongs in each half.
Start with the investment amount
Before you do any math, define the full spend clearly.
That means more than the software subscription or vendor invoice. It usually includes setup, migration, training, process design, internal implementation time, and any other upfront spend tied to the decision. If your team needs a refresher on what counts as a capital outlay, that’s a useful place to start because it helps separate a real investment from a routine operating expense.
If you understate the cost, the ARR will look better than reality. That’s one of the most common errors I see when teams pitch internal tools.
Work out average annual profit
This part needs discipline.
For ARR, you want accounting profit, not raw cash collected. In practical agency terms, that often means:
- New revenue from the investment
- Cost savings from reduced admin work or fewer write-offs
- Minus operating costs tied to the initiative
- Minus depreciation or other accounting treatment, where relevant
That’s why ARR can feel odd to people used to thinking only in cash terms. It follows accounting profit logic, which makes it different from metrics built around cash flows.
A good ARR estimate is boring in the best way. It uses assumptions your finance lead can trace, not assumptions your project sponsor hopes will happen.
Then calculate average investment
This is the part many non-finance teams miss.
ARR commonly uses average investment, not just the initial amount paid. A standard approach is to average the initial cost and the salvage value, then divide by two. If there’s no salvage value, the midpoint is often just half of the original investment under a straight-line depreciation assumption.
Why do this? Because the asset’s book value declines over time. ARR tries to compare profit against the average amount tied up in the asset over its life, not just day-one spend.
A clean worked formula
Here’s the sequence in plain terms:
Estimate total annual profit
Add expected gains and subtract expected ongoing costs.
Turn that into average annual profit
If profits vary by year, average them across the asset’s life.
Calculate average investment
Use the initial investment and salvage value, then take the average.
Divide profit by average investment
The result is your ARR percentage.
Why denominator choice matters
The denominator can change the answer a lot.
ACCA’s example shows this clearly. A $40,000 machine with $5,000 salvage value generates $8,000 in average annual profit. Using the average investment of $22,500, the ARR is 35.6%. That same source also shows how a different denominator can produce a different ARR, which is exactly why teams need to agree on the method before they compare options. See the ACCA explanation of rate of return.
If you’re leading project reviews, set the method first. Otherwise one manager will use initial spend, another will use average book value, and the comparison will be meaningless.
A short checklist before you trust the result
Use this before you share an ARR number with leadership:
- Check the profit line: Did you include only real revenue gains or cost savings, not vague productivity claims?
- Check the cost base: Did you include rollout labor, training time, and implementation work?
- Check the time horizon: Does the useful life make sense for the tool, service, or system?
- Check the denominator method: Is everyone using average investment the same way?
ARR is simple, but it only stays useful if the inputs are tight.
Worked ARR examples for your professional services firm
Most agency teams learn this metric faster when they can see it inside a familiar decision.
So instead of talking about industrial machinery in the abstract, let’s map the logic to professional services choices.
Example one software that cleans up delivery data
A mid-sized agency is considering a time and reporting platform because manual timesheets are creating billing disputes, missed internal work, and poor visibility by client.
The leadership team wants one simple question answered: “If we treat this as an investment, what annual accounting profit do we expect from it?”
One way to frame the math is to use a known ARR pattern and translate the business logic.
ACCA includes an example where a $200,000 equipment investment produces $40,000 in average annual profit, resulting in an ARR of 20%, which means 20 cents per dollar invested yearly. That ratio maps well to agency software decisions where the return comes from cleaner billing, lower admin effort, and fewer reporting errors.
Here’s how that thinking works in a services setting:
| Item | Agency interpretation |
|---|---|
| Investment | Software purchase, setup, training, internal rollout |
| Annual profit | Better billing capture, less admin rework, lower reporting effort |
| ARR result | Profit relative to the capital tied up in the project |
If the agency believes the platform will create the equivalent of $40,000 in average annual profit on a $200,000 investment, the ARR is 20%.
That doesn’t prove the purchase is right. It gives the team a clean benchmark.
If your finance lead says the company expects internal investments to beat a certain hurdle, this is the moment where the proposal either clears the bar or doesn’t. If the assumptions feel soft, then the work isn’t to argue harder. The work is to tighten the inputs.
A lot of agencies miss one practical step here. Before you claim any savings, make sure you know how your team records effort and billable work today. If that process is weak, this guide on calculating billable hours is a useful companion because billing accuracy often drives the “profit” side of the equation more than people expect.
Example two a new service line with uneven returns
The second case is closer to what growth-minded agencies face all the time.
You want to launch a new offer. Maybe it’s RevOps support, paid media analytics, implementation consulting, or a packaged audit. The returns probably won’t be even from year to year. There may be setup work, a slow start, stronger later years, and some residual value from the systems or assets you built along the way.
In such instances, ARR can still help, even if the income pattern is lumpy.
ACCA’s machine example is useful again because it shows uneven inflows over time. A company invests $40,000, receives total inflows of $75,000 over five years, assumes straight-line depreciation based on a $5,000 salvage value, and arrives at $8,000 in average annual profit. Using average investment of $22,500, the ARR is 35.6%.
For an agency service launch, the exact categories change, but the logic stays the same:
- Initial investment might include launch planning, sales enablement, tooling, and leadership time
- Profit pattern may vary by year because pipeline takes time to build
- Average annual profit smooths those uneven results into one usable number
- Average investment keeps the denominator consistent with ARR logic
“When returns are uneven, ARR still gives managers a way to compare one proposal against another without building a full finance model first.”
That’s useful when you have several internal bets on the table and need a disciplined shortlist.
What these examples teach in practice
The true lesson isn’t the formula. It’s the framing.
ARR works best when the proposal has a clear boundary. One investment. One estimated profit stream. One owner. One review point.
It works badly when teams bundle everything into a vague “transformation” case and call the whole thing profitable.
Use ARR on choices you can isolate. A software platform. A service rollout. A process automation project. A reporting rebuild. Once you can name the spend and estimate the profit, you can compare it to alternatives and make a sharper call.
ARR vs IRR, NPV, and ROI what's the difference
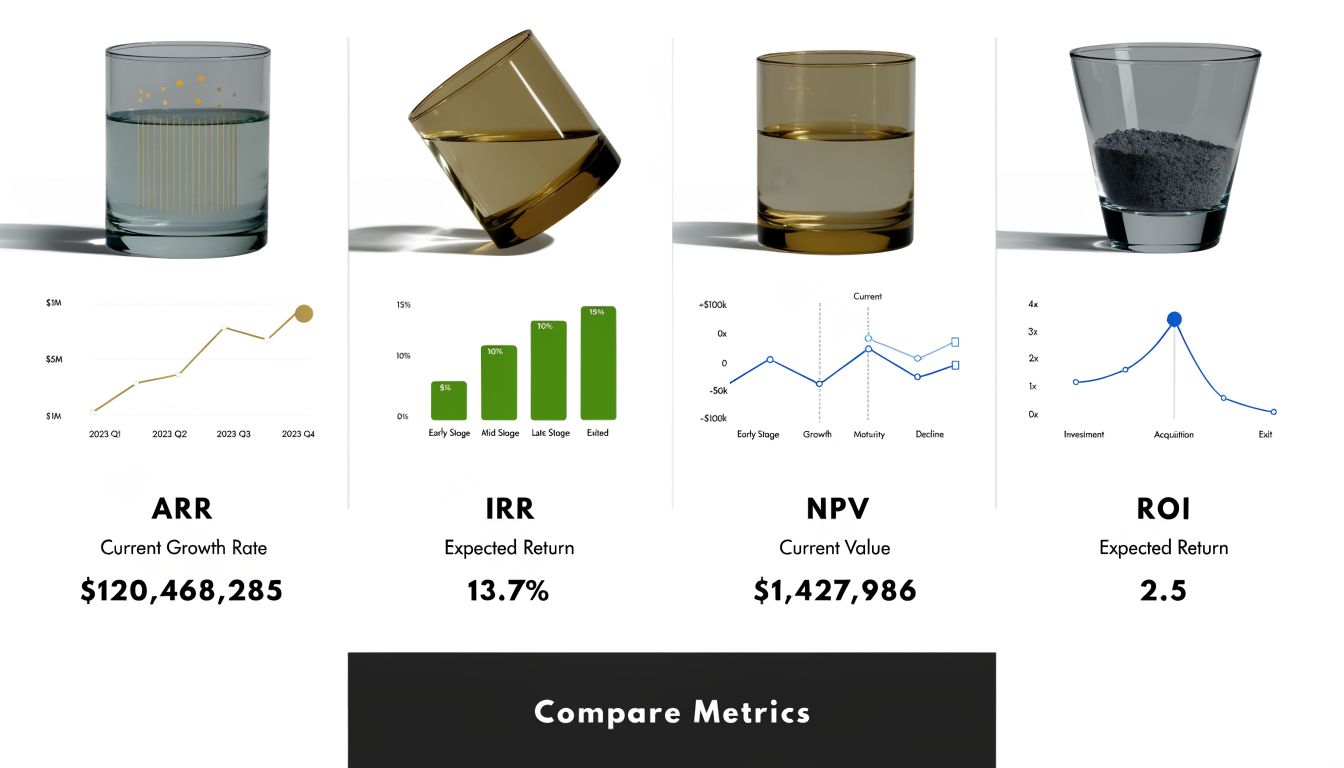
Agency teams often mix up ARR, ROI, IRR, and NPV because all four try to answer some version of “is this investment worth it?”
They are not interchangeable.
The fast way to separate them
Think of ARR as the quick accounting view.
Think of ROI as the broad return summary.
Think of IRR and NPV as deeper tools for timing-sensitive decisions.
A simple analogy helps. ARR is like looking at the sticker price and expected annual ownership benefit of a car. NPV and IRR are closer to calculating the full economics over time, including when money goes out and when it comes back.
Side-by-side practical differences
| Metric | What it focuses on | Best use in an agency |
|---|---|---|
| ARR | Accounting profit relative to average investment | Quick screen for tools, internal projects, service launches |
| ROI | Overall return relative to cost | Broad business cases and post-project reviews |
| IRR | Rate of return based on cash flow timing | Larger investments with uneven returns over time |
| NPV | Value created after considering timing of cash flows | Bigger capital decisions where timing matters a lot |
Where ARR wins
ARR wins when you need a clear answer fast and the audience includes non-finance managers.
If a client services lead, PMO head, or operations manager can understand the math in one minute, the discussion gets better. People stop arguing in generalities and start discussing assumptions.
That’s a real advantage in agencies, where many proposals come from delivery teams rather than finance.
Where ARR falls short
ARR does not account for the timing of cash flows.
That matters when two projects produce the same accounting profit but one returns value much sooner. It also matters when a proposal ties up money for a long time before any gain shows up.
Decision filter: Use ARR for a first-pass decision. Use IRR or NPV when timing, cash flow risk, or longer investment life could change the answer.
A practical way to choose the metric
Use this rule set:
- Use ARR when you need a simple profitability screen that operations leaders can work with
- Use ROI when you want a broad “what did we get back?” view without heavy finance detail
- Use IRR when return timing is uneven and you need a rate-based cash flow view
- Use NPV when leadership wants the most financially complete view of long-term value
ARR is not “worse” than the others. It’s narrower.
That’s why it’s useful. A narrow tool can still be the right one if the decision is routine, the variables are reasonably stable, and the team needs clarity more than complexity.
Strengths and weaknesses of ARR for service businesses
ARR has lasted this long because it solves a real management problem.
It gives busy teams a usable number without forcing every internal decision through advanced financial modeling. For service businesses, that matters because most investment choices are smaller, more frequent, and tied to workflow rather than heavy physical assets.
Still, ARR can mislead you if you ask it to do more than it can do.
Where ARR works well
The biggest strength is simplicity.
Project managers, department leads, and operations people can follow the logic without needing finance training. That makes ARR useful in review meetings because people can challenge assumptions directly. Was the profit estimate too aggressive? Did we miss implementation time? Are we overstating useful life? Those are productive questions.
ARR also works well because service firms usually already have the raw ingredients, or at least part of them:
- Profit estimates from budgets, retainers, and margin models
- Investment costs from software contracts, rollout plans, or internal project scoping
- Useful life assumptions based on how long a tool or process change is likely to stay relevant
- Comparability across projects competing for the same budget
Where ARR gets shaky
The biggest weakness is that ARR ignores the time value of money.
If one initiative pays back earlier and another pays back later, ARR may treat them as similar when they are not. For agencies, that can matter if one project starts improving billing next month while another needs a long setup before any return shows up.
The second problem is that ARR uses accounting profit, not cash flow.
That’s fine for some decisions. It’s less fine when your clients pay late, contracts slip, or revenue recognition looks clean on paper while cash collection drags in real life. A service business can appear profitable and still feel pressure if cash comes in slowly.
A third problem is data quality. If the underlying cost data is weak, the ARR is weak too. That’s where costing discipline matters. If your team wants a stronger handle on how work consumes labor and overhead, this explanation of what is activity-based costing is worth reading because many agencies underprice internal effort without realizing it.
ARR is good at forcing a decision into numbers. It is bad at fixing bad numbers.
The best way to use it
Use ARR as a screen, not a verdict.
For smaller operational choices, it may be enough on its own. For larger bets, use it to narrow the field, then pressure-test the finalists with a more detailed view of cash timing, delivery risk, and operational reality.
That’s how ARR earns its place in a service business. Not as the final word, but as a clear first question.
Fueling your ARR calculation with accurate activity data
The hardest part of accounting rate return in an agency usually isn’t the formula.
It’s the input quality.
If your team doesn’t know where time goes, then your estimated profit is partly guesswork. And in a service business, time is often the main cost base. That means weak activity data distorts the very number you’re using to approve tools, process changes, and internal projects.

Why manual reporting weakens the metric
Many agencies still build internal investment cases using rough manager estimates.
A leader guesses how much admin time a tool will save. A department head estimates how much non-billable work a process change will remove. Finance backs into a number from broad payroll averages. The math may look tidy, but the underlying evidence is thin.
That matters because ARR depends on average annual profit. If you overstate saved effort, undercount rework, or miss hidden non-billable time, your ARR looks stronger than reality.
Recent projections from 2025 to 2026 cited by 365 Financial Analyst note that AI platforms that automate activity categorization can reduce manual reporting by 40% in mid-sized agencies, can improve ARR on resource projects from 5.5% to 8.2%, and Q1 2026 surveys indicate a 16% boost to the net income component of the ARR calculation. Those figures appear in their discussion of what is accounting rate of return.
The practical point is simple. Better activity capture changes the numerator. It can also change how confidently you trust the numerator.
What better input data looks like
For agencies, stronger ARR analysis usually starts with activity data that can answer questions like these:
Where is non-billable time going
Internal meetings, status work, client admin, reporting cleanup, and handoff friction add up fast.
Which clients or projects create hidden effort
The issue often isn’t visible in top-line revenue. It shows up in delivery drag.
Which tasks repeat often enough to justify automation
If the work is recurring, the profit case gets easier to support.
Where accounting profit is being lost
Missed billable entries, slow reporting, and manual categorization all erode margin.
If your operation still relies on retrospective timesheets, this gets harder than it should be. Agencies that want cleaner operational inputs often move toward systems built around live activity capture and time categorization. For a broader view of that operating model, see this guide to time tracking for agencies.
Don’t separate ARR from the rest of the revenue chain
ARR also improves when it connects to downstream systems.
If time data is clean but billing is messy, the financial picture is still incomplete. In practice, agencies get a better read on operational return when time capture, job costing, and invoicing reinforce each other. Even something as basic as choosing a cleaner online invoice system can tighten the link between effort, value delivered, and profit recorded.
Better investment decisions start with better operational evidence, not better spreadsheet formatting.
That’s the part many teams skip. They debate the percentage before they fix the measurement.
Putting ARR to work in your agency's decisions
Most agencies don’t need more metrics. They need to use a few metrics more often, with more discipline.
Accounting rate return is one of those. It gives operators a fast, understandable way to judge whether an investment deserves budget. Used well, it pushes teams to define the spend, estimate the profit, and defend the assumptions in plain English.
Where to use it this quarter
Start with decisions that are common, bounded, and expensive enough to matter.
Software purchases
Before you approve a platform, estimate the annual profit from saved admin effort, better billing accuracy, or reduced reporting load, then compare it to the investment.
New service offers
If you’re packaging a new capability, use ARR to test whether launch costs and internal setup are justified by likely average annual profit.
Internal process projects
Workflow redesign, automation work, and reporting rebuilds often sound smart. ARR forces a harder question: how much accounting profit will this create?
Department-led investment requests
When a team lead asks for budget, require an ARR case. It doesn’t need to be elaborate. It does need to be specific.
A practical approval habit
You don’t need a giant template.
You need a repeatable decision habit. Ask every proposal owner for four things:
- The total investment
- The expected average annual profit
- The useful life of the decision
- The reason the assumptions are credible
If they can’t provide that, the proposal isn’t ready.
What changes when teams adopt this
The biggest change isn’t mathematical. It’s behavioral.
Managers stop pitching investments as abstract improvements. They start tying them to profit. Finance spends less time translating fuzzy requests into decision-ready language. Operations gets a cleaner way to compare internal projects that all sound worthwhile on the surface.
That’s why I like ARR for agency environments. It respects the reality that not every decision needs deep corporate finance, but every serious spend should clear some financial test.
Use it to sort, compare, and challenge. Then, for bigger bets, bring in deeper analysis where it belongs.
If your agency wants cleaner ARR inputs, the first fix usually isn’t another spreadsheet. It’s better activity data. TimeTackle helps teams capture calendar-based work, categorize it with less manual effort, and turn time data into reporting that finance and operations can trust. That makes it easier to evaluate software, workflows, clients, and internal projects with numbers that are grounded in how your team really works.