A packed dining room can fool you.
Tickets fly, the kitchen stays buried, guests seem happy, and the bank balance still feels wrong. Owners usually describe it the same way. “We're busy all the time, so why does profit feel so thin?” That question almost always leads back to one number. Not vibes. Not sales alone. The food cost percentage equation.
Most operators learn a simple version first. It's useful, but it's not enough if you want the truth. The version that helps you run the place is the inventory-based one, because it catches the stuff that eats margin: waste, spoilage, staff meals, over-portioning, and theft. If you only look at purchases against sales, you can talk yourself into thinking the business is tighter than it is.
That's why serious operators count inventory, compare it to sales, and track the number on a steady rhythm. Once you trust the number, menu pricing gets sharper, ordering gets cleaner, and cost problems show up faster.
Why your busy restaurant might not be making money
I've seen this pattern more times than I can count. A restaurant has strong traffic, solid reviews, and a kitchen team that can push volume. On paper, it should work. In practice, the owner keeps asking where the cash went.

The answer usually isn't one dramatic mistake. It's a pile of ordinary leaks. Prep cooks trim too aggressively. Portions drift during a rush. Cases get over-ordered before a weekend, then spoil. Managers trust vendor invoices but don't compare them to what left the shelf. By the time someone reviews profit and loss statements, the damage is already baked in.
That's why food cost sits near the center of restaurant control. You can be busy and still lose ground if your cost of goods is higher than you think. You can also have a month that looks fine on sales, while inventory movement says the kitchen is burning margin.
Busy does not mean efficient
A full house creates noise. Noise makes weak controls easier to miss.
If you want a clean read on restaurant health, start with food cost before you start blaming labor, rent, or marketing. Those matter too, but food cost is the number that tells you whether your kitchen is converting inventory into revenue the way you think it is.
A restaurant can sell a lot of food and still fail to control what it consumes to make those sales.
When owners review spending, they often focus on purchases because purchases are easy to see. But purchases only tell you what came in. They don't tell you what got wasted, spilled, comped, stolen, or left to die in the walk-in.
The number that turns activity into insight
The food cost percentage equation matters because it turns a messy operation into something measurable. Once you track it well, you stop guessing.
That same discipline also helps when you review broader overhead. If you're tightening the full cost structure, this guide to calculating operating expenses for a business is a useful companion to your kitchen-side analysis.
Here's the hard truth. Restaurants rarely fail because owners don't care enough. They fail because they don't get a true reading fast enough, and a bad number can hide inside a busy service for a long time.
The basic food cost percentage equation
Many restaurant owners and operators meet the food cost percentage equation in its simplest form:
Food cost percentage = COGS ÷ food sales × 100
That basic version gives you a starting point. If your cost of goods sold rises faster than food sales, your margin gets squeezed. If it drops while sales stay healthy, your kitchen may be executing better.
What the simple version means
Start with COGS, or cost of goods sold. In restaurant terms, that's the value of the food you used to generate sales during a period.
Then look at food sales, which is the revenue from food sold during that same period.
Divide COGS by food sales, then multiply by 100. The result is your food cost percentage. According to McDonald Paper's guide to the food cost formula, the inventory-based food cost percentage formula has become a foundational profitability metric, most restaurants operate between 30% and 35%, and prime cost, food plus labor, should stay at 55% or lower to achieve profitability.
Why this basic view helps
The simple version is easy to understand, which is why people start there. It gives managers a common language for talking about kitchen performance, menu margins, and purchasing discipline.
Used well, it can help you answer questions like these:
- Are ingredient costs rising faster than sales? If yes, your margin is under pressure.
- Did a menu change push costs up? A shift in the ratio often shows that before anyone feels it in cash.
- Are you pricing too loosely? If sales look strong but food cost stays high, price may be part of the problem.
- Is prime cost drifting out of range? Food cost feeds directly into that broader measure.
Where the basic version falls short
The problem is simple. A restaurant is not a spreadsheet. Food moves.
You buy product, trim it, prep it, waste some of it, lose some of it, sell some of it, and count what remains. If you ignore inventory movement, the simple equation can miss the story that matters most. Two periods can show similar purchasing activity while the kitchen performs very differently.
Practical rule: If you want a fast estimate, the basic equation is fine. If you want to manage a real kitchen, it isn't enough.
That's where operators move from the classroom formula to the one that helps them run the business.
The real equation operators use for accurate tracking
The version that matters in practice is this:
(Beginning Inventory + Purchases − Ending Inventory) ÷ Food Sales
That is the food cost percentage equation operators trust when they want a number they can act on. It tracks inventory flow, not just spending. That one difference changes everything.
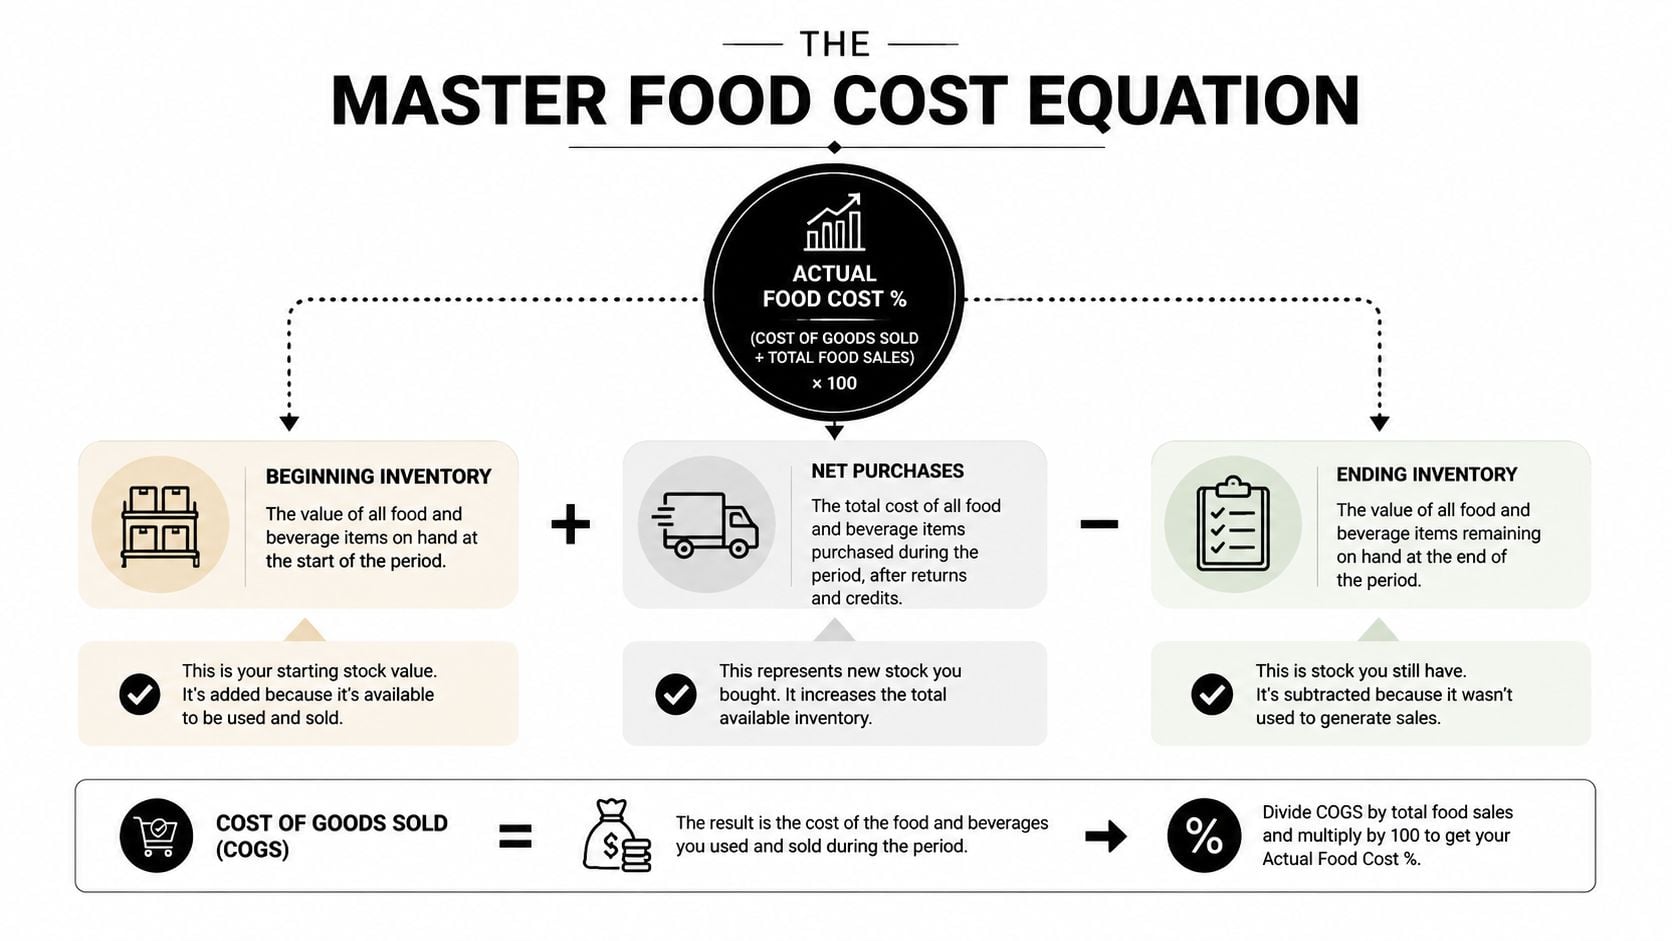
Why inventory flow gives you the truth
Beginning inventory tells you what you had on hand at the start. Purchases tell you what came in. Ending inventory tells you what's left. What disappeared in between is what the operation consumed.
That consumed amount is what you should compare to food sales.
This is why the inventory-based formula is superior. It captures what the kitchen used, whether that use was productive or sloppy. If food vanished because of spoilage, overproduction, theft, or bad portion control, the equation does not care about your excuse. It still shows up in the result.
According to Sling's explanation of food cost percentage, the operational control metric is derived from inventory flow. In their example, a restaurant starts with $16,000 in inventory, buys $4,000, ends with $17,000, and generates $10,000 in food sales. The food cost percentage is 30%.
What this catches that the simple formula misses
A purchasing report can look normal while kitchen controls fall apart. That's why I push operators to stop treating invoices as the full story.
This formula exposes common problems:
- Waste in prep: Trim loss, spoilage, and expired product still count.
- Portion drift: A line cook adding “just a little more” all week will move the number.
- Theft and unrecorded use: Missing product becomes part of consumption whether it was sold or not.
- Inventory timing games: Big orders at period-end can distort a purchases-only view.
- Overproduction: Food made and discarded hurts cost just as much as food stolen.
Why this is the number to manage weekly
A month is too long if your controls are shaky. By the time a monthly result lands, the team has repeated the same mistakes for too many shifts.
Weekly tracking works better because it keeps inventory timing from hiding the actual trend and gives managers a shorter feedback loop. You don't need perfect complexity. You need a clean count, a consistent method, and the discipline to review variances while people still remember what happened.
If the number moves and you can't explain why, that's not a reporting problem. That's an operating problem.
Many articles stop at the simple formula because it's easy to teach. The inventory-based version is the one that helps you make decisions with your eyes open.
A worked example in excel and google sheets
Most operators don't need another theory lesson. They need a sheet they can use today.
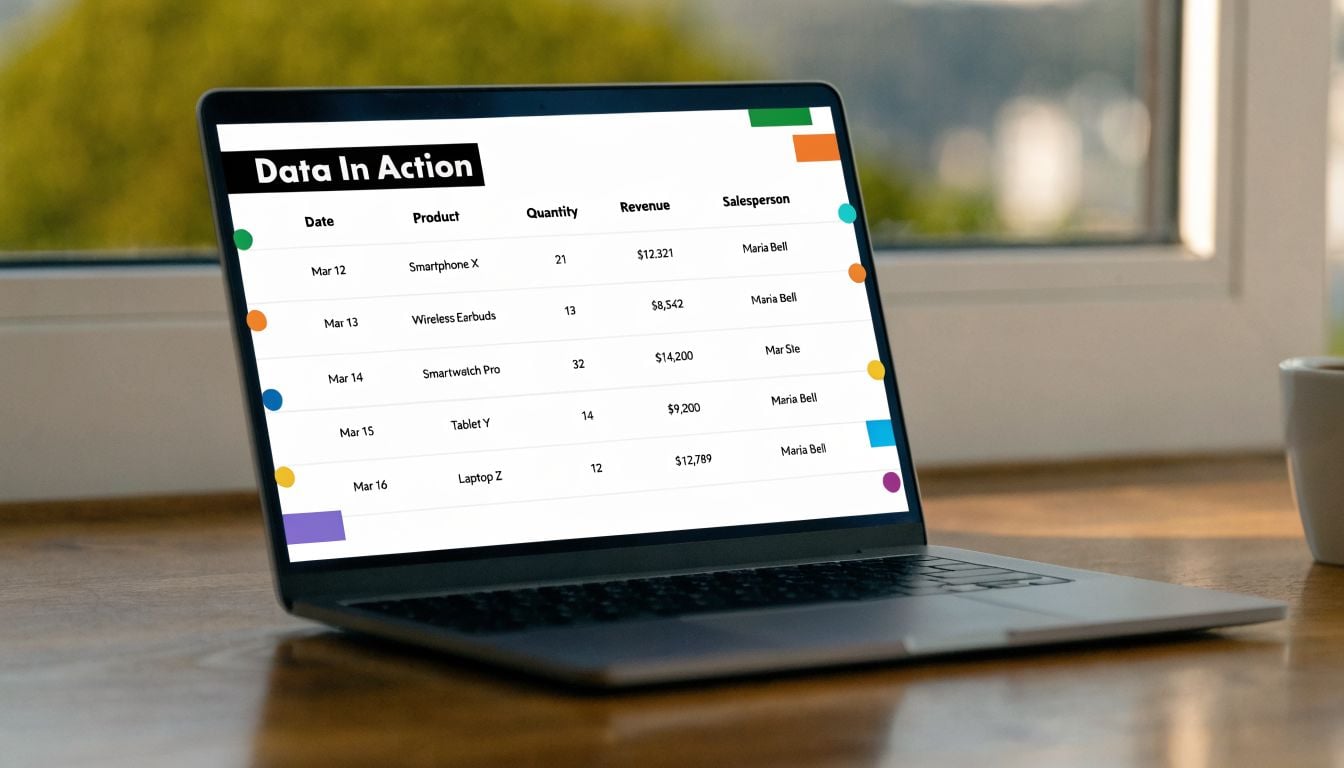
Here's a clean way to set it up using the inventory-based equation. I'm using a verified sample because the mechanics matter more than the story around it.
Set up the sheet
Create a small table with these labels in column A:
| Cell | Label |
|---|---|
| A2 | Beginning Inventory |
| A3 | Purchases |
| A4 | Ending Inventory |
| A5 | Food Sales |
| A6 | Food Cost Percentage |
Now enter these values in column B:
| Cell | Value |
|---|---|
| B2 | 16000 |
| B3 | 4000 |
| B4 | 17000 |
| B5 | 10000 |
These figures come from the Sling example cited earlier. They produce a food cost percentage of 30%.
Use the actual spreadsheet formula
In both Excel and Google Sheets, enter this in B6:
=(B2+B3-B4)/B5
Then format B6 as a percentage.
If you want the result shown as a percentage number directly, not just decimal format, use:
=((B2+B3-B4)/B5)*100
That second version is useful if you prefer a plain numeric output in reports you export or share.
Make the sheet easier to trust
The math is simple. The errors come from bad inputs.
A few practical rules make a spreadsheet far more reliable:
- Lock the counting process: Use the same units every time. If one week uses cases and the next uses eaches, your sheet becomes fiction.
- Match the period exactly: Inventory dates and sales dates must line up. If they don't, the ratio lies.
- Separate food from non-food purchases: Paper goods, cleaning supplies, and smallwares belong elsewhere.
- Keep one source of truth for sales: Pull sales from your POS consistently, not from ad hoc manager notes.
If your team already works in shared reporting environments, this guide on Google Sheets time tracking and reporting workflows is useful for building cleaner recurring processes around operational data.
Spreadsheets don't fail because formulas are hard. They fail because teams feed them inconsistent counts.
A simple weekly habit
At the end of each counting period, ask two questions:
- Did the percentage move?
- Can we explain the movement in plain language?
If the answer to the second question is no, dig before you move on. Check waste logs, purchasing changes, menu mix, comps, and inventory count quality. The formula is just the trigger. The value comes from the conversation it forces.
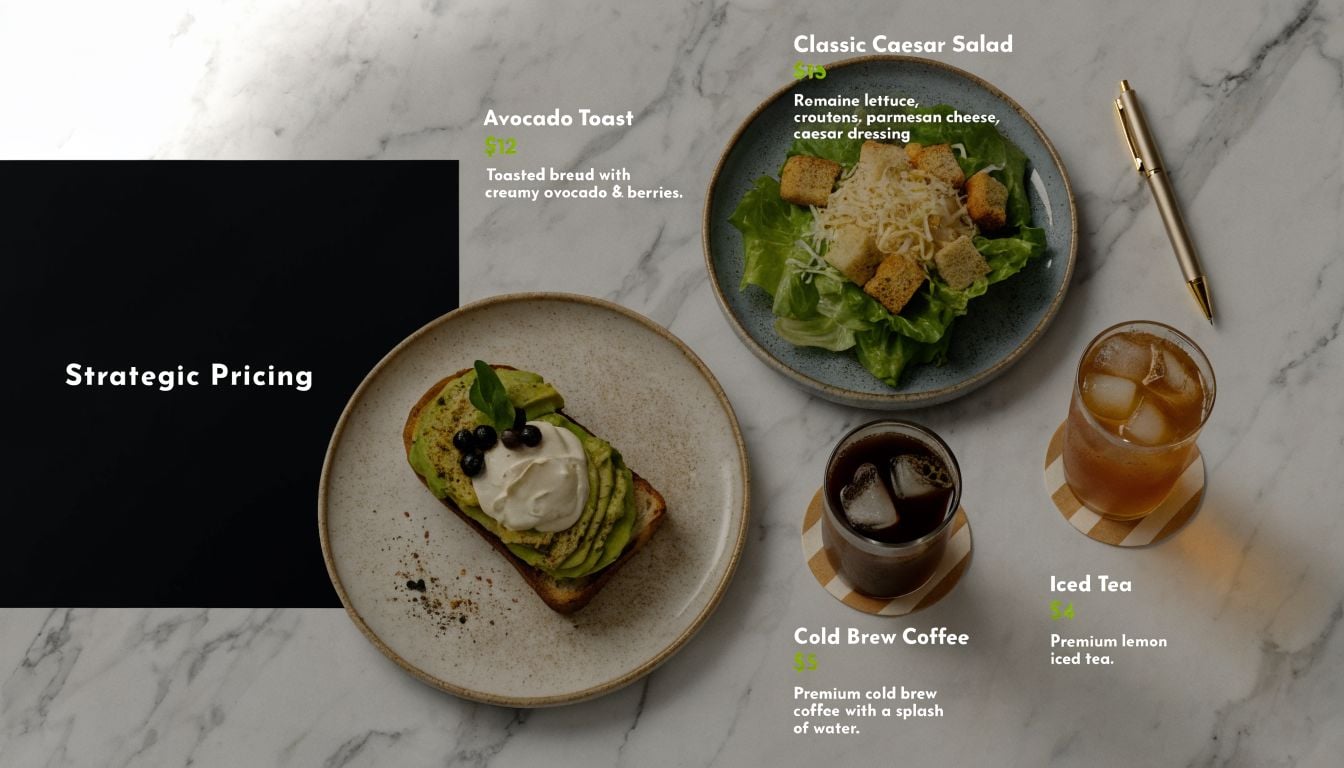
Using the equation to set profitable menu prices
Once you know your actual food cost, you can stop pricing by instinct.
A lot of menus are priced from the guest side only. Owners look at competitors, round to a number that feels marketable, and hope the margin works. Sometimes it does. Often it doesn't. The better approach is to start with plate cost, decide the food cost percentage you want, and work backward.
The reverse pricing formula
The pricing formula is:
Menu Price = (Food Cost ÷ Desired Food Cost Percentage) × 100
According to Culinary Arts Switzerland's explanation of food cost percentage pricing, if a dish costs $4 to produce and the target food cost percentage is 30%, the menu price should be $13.33.
That formula is simple, but it changes how you think. Instead of asking, “What can we charge?” you ask, “What must we charge if we want this item to carry its share?”
How operators actually use it
This works best when you apply it item by item, not only at the full-restaurant level. Some dishes can carry a tighter ratio because they drive volume or brand identity. Others need stronger margin because they're labor-heavy, waste-prone, or built on volatile ingredients.
Use the formula as a decision tool, then pressure-test the result.
For each menu item, ask:
- Does the calculated price fit our market? If not, the recipe may need work.
- Is the portion too generous for the concept? If guests regularly leave food behind, you may be buying margin you never sell.
- Does the item create waste elsewhere? A plate can look fine in isolation and still cause spoilage through low-turn ingredients.
- Are we ignoring labor and overhead? Food cost is not the whole story, so don't price blind.
When the formula says no
Some dishes don't earn their place. That's not a failure. That's clarity.
If the target price comes out too high for your guest base, you usually have four real options:
- Change the portion.
- Change the build.
- Raise the price and defend the value.
- Remove the item.
What doesn't work is leaving a weak item on the menu because people like the idea of it. A popular low-margin dish can drain the kitchen faster than an unpopular one.
If you're also reviewing how direct and indirect costs shape pricing, this guide on how to calculate production cost is a helpful companion.
A menu price should come from math first, then judgment. Not the other way around.
Common mistakes and how to lower your food cost
Most food cost problems don't come from not knowing the equation. They come from using it badly, using the wrong version, or ignoring what it says.
That's why so many operators stay stuck. They calculate a number, glance at it, then move on without changing behavior. The food cost percentage equation only helps if it changes what managers do on the floor, in prep, and with vendors.
According to US Foods' article on tracking food cost percentage, many restaurants average roughly 30% to 35% food cost percentage, and the practical issue is not just what the equation is, but which version you should trust for decisions. That's the right question.
Mistakes that make the number useless
Some errors break the math. Others keep the math intact but make the result meaningless.
- Counting inventory inconsistently: If one manager estimates and another counts carefully, your trend line is noise.
- Using the simple formula for operational control: It's fine for a rough read, but weak for diagnosing day-to-day kitchen performance.
- Ignoring waste and comps: If product leaves the shelf and no one records why, the kitchen loses twice. First in product, then in visibility.
- Mixing time periods: Weekly sales matched to partial inventory periods produce bad conclusions.
- Treating high sales as proof of good cost control: Volume can hide sloppy execution for longer than people think.
What actually lowers food cost
You don't lower food cost by yelling at the chef to “watch it.” You lower it by tightening the system.
Here are the fixes that work in real operations:
- Standardize portioning: Use scales, measured scoops, recipe cards, and line checks. Good cooks still need guardrails during a rush.
- Tighten ordering habits: Order to movement, not to fear. Panic ordering fills coolers and creates future waste.
- Count the same way every time: Same day, same process, same unit of measure, same level of manager review.
- Review vendor changes quickly: A price jump on a core ingredient should trigger a recipe or pricing review, not a shrug.
- Trim weak menu items: If an item creates poor margin, low movement, or hard-to-use inventory, fix it or cut it.
A practical operating checklist
Use this as a weekly review with your kitchen manager or GM:
| Check | What to ask |
|---|---|
| Inventory count quality | Did we count cleanly and consistently? |
| Variance review | Which categories moved, and why? |
| Waste tracking | Did we record spoilage, mistakes, and staff consumption? |
| Menu mix | Did sales shift toward lower-margin items? |
| Purchasing discipline | Did we buy for actual need or for comfort? |
Good cost control is boring on purpose. The best-run kitchens repeat the same habits until the numbers stop surprising them.
The trade-offs operators need to accept
Every cost decision has a downside if you push it too far.
Cut portions too hard, and guests notice. Buy the cheapest product, and quality slips. Trim menu variety too aggressively, and regulars lose reasons to come back. Lock ordering down too tightly, and the kitchen starts service under pressure. The goal isn't the lowest possible number. It's a controlled number that fits your concept, quality standard, and price position.
The operators who do this well don't chase perfection. They build a rhythm. Count. compare. question. adjust. repeat.
If you want cleaner operational reporting without chasing people for manual logs, TimeTackle helps teams capture work automatically from calendars and connected systems, then turn that activity into usable reporting. For operators, finance leaders, and service teams who are tired of spreadsheet cleanup, it's a practical way to spend less time assembling data and more time acting on it.