


Revenue is up. The team is slammed. Clients keep asking for more. Yet when you look at cash, the business feels tighter than it should.
That's a familiar agency problem. You can hit your sales target and still feel like something is off, because top-line growth doesn't tell you which work is healthy and which work is eating your capacity. Most agencies don't have a revenue problem first. They have a visibility problem.
The metric that usually clears this up is the gross profit rate equation. Not because the math is hard. It isn't. It matters because it gives you a clean way to see whether your delivery model is making money before overhead muddies the picture.
The profitability puzzle every agency faces
An agency owner looks at the monthly report and sees solid revenue. On paper, things look fine. In practice, account leads are writing off hours, senior people are stepping into delivery to rescue deadlines, and project managers are stretching scopes to keep clients happy.
The result is a business that looks busy but feels thin.
I've seen this in agencies that thought they had a pricing issue, when the actual problem was delivery discipline. I've also seen the reverse. Teams blamed scope creep, but the larger issue was that they never priced direct labor properly in the first place. When you don't separate profitable work from expensive work, every client starts to look roughly the same.
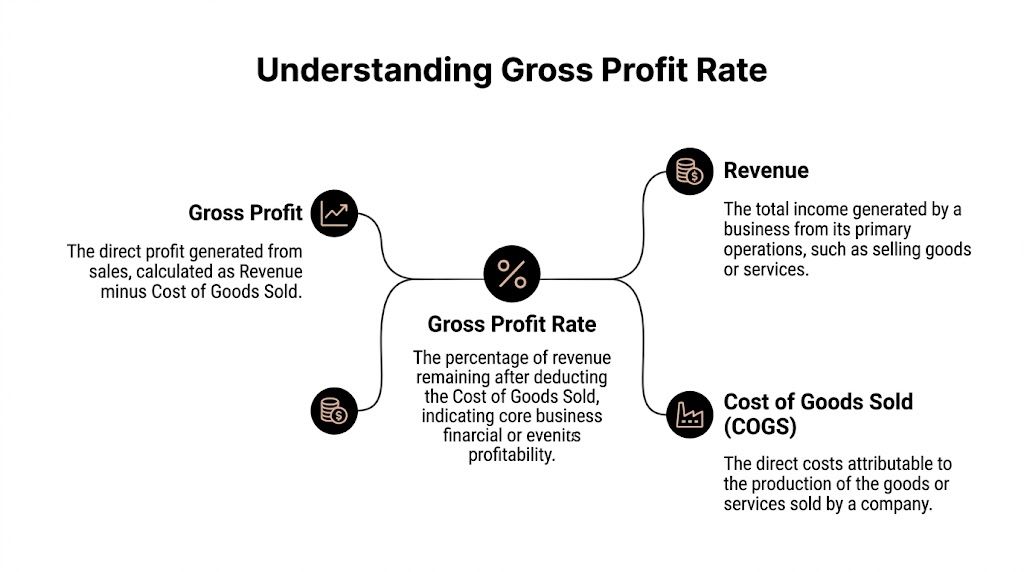
That's where gross profit rate starts earning its keep. It shows how much revenue is left after the direct cost of delivering the work. For agencies, that usually means direct labor first, then any other costs tied directly to client delivery.
A healthy agency can still feel cash-starved if it wins the wrong work, prices loosely, or lets direct delivery costs drift without noticing.
The practical value is simple. You can stop asking, “Are we growing?” and start asking better questions:
- Which clients absorb more senior time than we planned
- Which service lines look good in revenue reports but run thin in delivery
- Which projects keep needing make-good hours
- Where margin drops before the P&L makes it obvious
If your current reporting only tells you total revenue and total payroll, you're flying too high above the problem. You need a metric that gets closer to the work itself. That's why many ops leaders end up spending time on profitability systems, not just billing systems. This is also why a lot of teams looking for ways to increase profitability eventually end up fixing time capture, labor mapping, and project reporting before they touch pricing.
What the gross profit rate equation reveals
The equation is straightforward:
Gross profit rate = (Revenue − COGS) / Revenue × 100
According to Salesforce's gross profit margin guide, the gross profit rate is a normalized efficiency metric defined as (Revenue − COGS) / Revenue × 100, which makes it directly comparable across different firms, service lines, and periods. The same source gives a simple example: a $300,000 gross profit on $500,000 revenue is a 60% rate, while the same profit on $1,000,000 revenue is only 30%, which shows why the percentage is more useful than the dollar amount alone.
Why agencies should care about the percentage
Gross profit dollars can look impressive and still hide a weak delivery model. A big account may throw off a large gross profit amount due to its size. That doesn't mean it is efficient.
The percentage fixes that. It lets you compare:
- One client against another
- Retainer work against project work
- This quarter against last quarter
- A design team against a paid media team
That normalized view matters in agencies because different books of business can have very different pricing models, staffing patterns, and delivery effort.
What belongs in revenue and COGS
Revenue is the income from the work you sold. In agency terms, that often includes retainers, project fees, implementation fees, and other billed services.
COGS is where agencies get into trouble. For a service business, the biggest item is usually direct labor. If a strategist, designer, consultant, media buyer, developer, or project manager spends time delivering client work, that cost often belongs in COGS, not general overhead.
That distinction is what makes the metric useful. The ratio strips out operating expenses, depreciation, amortization, interest, and taxes so you can isolate delivery efficiency and pricing power. That's also why a basic profit and loss report can confuse people. If you need a plain-English refresher on how the lines fit together, the Professional Careers Training accountancy guide is a good reference.
Practical rule: If a cost exists because you are delivering a specific client service, test whether it belongs in COGS before you bury it in overhead.
How to calculate gross profit rate with worked examples
Start simple. Then get more granular.
At the company level, the math is easy enough to do in a spreadsheet. But the true value for an agency shows up when you run the same logic by project and by client.

A basic worked example
Deskera's guide notes that gross profit rate is highly sensitive to how costs are classified. It gives an example where $1,000,000 in sales and $350,000 in COGS produces a 65% rate, and adds that each 1-point improvement directly increases the funds available to cover fixed costs when direct labor is classified correctly in COGS. You can see that in the Deskera gross profit percentage formula article.
The mechanics are:
- Take revenue
- Subtract COGS
- Divide the result by revenue
- Convert to a percentage
That gives you a company-wide read on delivery efficiency before overhead.
What this looks like inside an agency
Many teams stop their analysis too early. A company-wide rate is useful, but it won't tell you which client is causing the problem.
For agency work, use the same equation at smaller levels:
| View | Revenue input | COGS input | What it tells you |
|---|---|---|---|
| Company | Total billed revenue | Total direct delivery cost | Overall delivery health |
| Client | Revenue from one client | Direct labor and delivery cost for that client | Whether the account is worth keeping or repricing |
| Project | Fee for one project | Direct time and direct project costs | Whether the scope was sold and run properly |
| Service line | Revenue by service | Direct staffing tied to that service | Which offer actually carries margin |
A project-level approach that works
For a single project, gather:
- Billed amount for that project
- Time logged by each delivery role
- Loaded labor cost for those roles
- Any direct vendor or contractor costs tied to delivery
Then calculate direct labor cost from tracked hours. If your team still struggles to do that consistently, a simple labor cost formula framework helps clean up the input side before you try to interpret the margin.
A rough process looks like this:
- Pull all time entries tied to the project.
- Separate direct delivery time from internal admin time.
- Apply the relevant labor cost to each role.
- Add direct outside costs, if any.
- Run the gross profit rate equation.
Hidden leaks become apparent. A project that looked fine when sold can go soft because a senior lead spent too much rescue time on revisions, or because internal coordination ballooned after kickoff.
If your project reports only compare fee to budgeted hours, you're missing the cost side. Margin gets lost in that gap.
A client-level view is even more useful
Project profitability can bounce around. Client profitability tells you whether the relationship works.
A client can have one messy project and still be a strong account overall. Another client can pay on time, renew often, and still be weak because the team constantly does unpaid strategy, rushed revisions, and hand-holding across multiple workstreams.
That's why I prefer to review client gross profit rate over a period, then inspect the projects inside it. The first view tells you where to look. The second tells you what to fix.
Common mistakes when calculating agency profitability
Most agencies don't fail on the formula. They fail on the inputs.
The gross profit rate equation is simple enough that people assume the answer must be right if the spreadsheet calculates cleanly. But a clean spreadsheet with bad classifications is still bad reporting.
Misclassifying direct labor
The biggest mistake is treating direct delivery labor as overhead because it's administratively easier. That usually happens with roles that sit between delivery and coordination, like project managers, implementation leads, or technical strategists.
If the person is part of delivering the client work, their direct time should be tested for COGS treatment. If you dump too much of that cost into overhead, your gross profit rate looks better than reality.
That gives leadership the wrong read on pricing and staffing. It can also make weak accounts look healthy long enough to become habits.
Ignoring mixed revenue models
Hourly points out a gap that matters a lot for agencies with retainers, subscriptions, implementation work, and bundled services. A single company-wide rate can hide where profitability is created or destroyed, which is why Hourly's article on calculating gross profit says segment-level analysis is often required for an accurate picture.
That matters if your agency has any mix of:
- Recurring retainers with uneven delivery effort
- Fixed-fee projects with revision risk
- Advisory work bundled into execution
- Subscription or platform revenue alongside services
A blended number may look stable while one service line keeps dragging down the rest.
Trusting average rates too much
Average labor rates save time in a model, but they can distort reality. If your highest-cost people are the ones most often pulled into problem accounts, an average rate can make those accounts look cleaner than they are.
You don't need perfect accounting purity for every report. But you do need a method that reflects who did the work.
Treating non-billable delivery time like it doesn't exist
Agencies often count billable time and ignore the surrounding effort that still exists because of the client. Internal reviews, status prep, handoff meetings, QA, and rework all consume labor.
If that work supports delivery, it still affects gross profit, even if you never invoice it.
“If the client creates the work, the work creates cost.”
That's why narrow timesheet categories can backfire. They create the appearance of efficiency by hiding the labor that made the delivery possible.
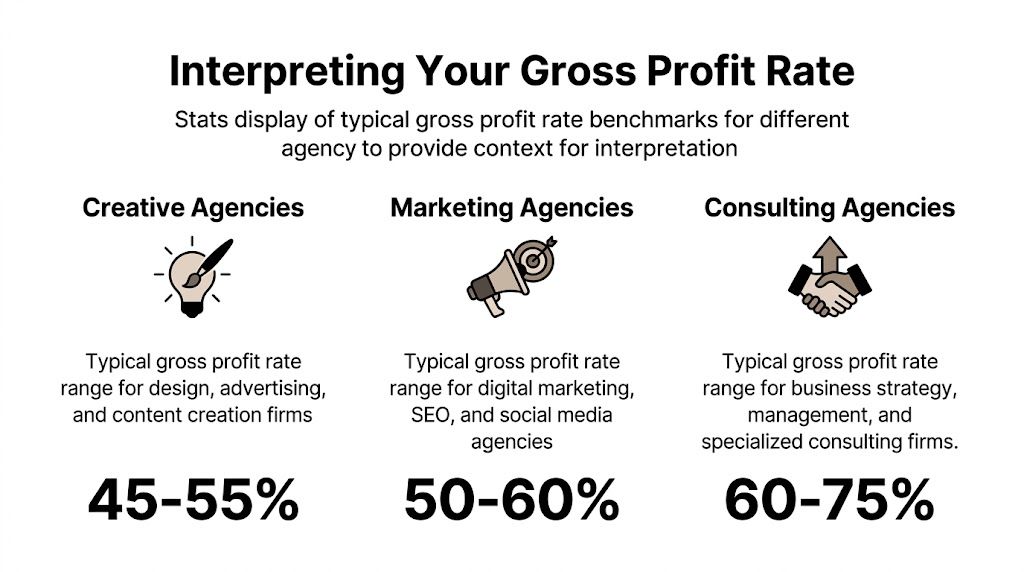
Interpreting your gross profit rate
A single percentage on a dashboard doesn't mean much by itself. The useful question is what changed, where it changed, and whether the shift came from price, staffing, or delivery behavior.
Read the trend before the absolute number
A rising gross profit rate usually points to some combination of stronger pricing, better labor allocation, less rework, tighter scope control, or a healthier mix of work.
A falling rate usually means the opposite. The team may be spending more direct time to deliver the same revenue. Or the agency may be discounting, over-servicing, or carrying delivery inefficiency that revenue growth is hiding.
Wall Street Prep makes an important point here. Gross margin can improve even when pricing weakens, or fall even when revenue grows, because COGS can move faster than sales. That's why it works as an earlier operating signal than a backward-looking score, as noted in Wall Street Prep's gross profit guide.
Questions worth asking when the rate moves
When the rate drops, I'd start here:
- Did one client absorb unusual senior time
- Did a service line need more revisions or QA than expected
- Did we classify labor differently this period
- Did vendor or contractor costs rise on direct delivery work
When the rate rises, don't celebrate too fast. Check whether the gain came from something repeatable, such as better scoping or staffing, instead of a temporary lull in direct labor.
Use it as an operating signal
This is not just a finance metric. It's an operations metric.
A good gross profit rate review should lead to decisions like:
| Signal | Likely issue | Next move |
|---|---|---|
| Rate falls on one client | Scope drift or underpricing | Re-scope, reprice, or cut delivery load |
| Rate falls across one team | Staffing or process problem | Review utilization, handoffs, and QA flow |
| Rate rises after pricing changes | Better value capture | Test whether the change holds over time |
| Rate is flat but net profit worsens | Overhead issue | Move to operating expense review |
If you want a broader finance lens beyond margin alone, this overview of ratio analysis for UAE businesses is useful because it puts gross-level metrics beside other operating ratios leaders often track.
Gross profit rate vs gross margin and net margin
These terms get mixed together all the time, and in practice that leads to bad conversations between finance, ops, and client service.
Gross profit rate and gross margin
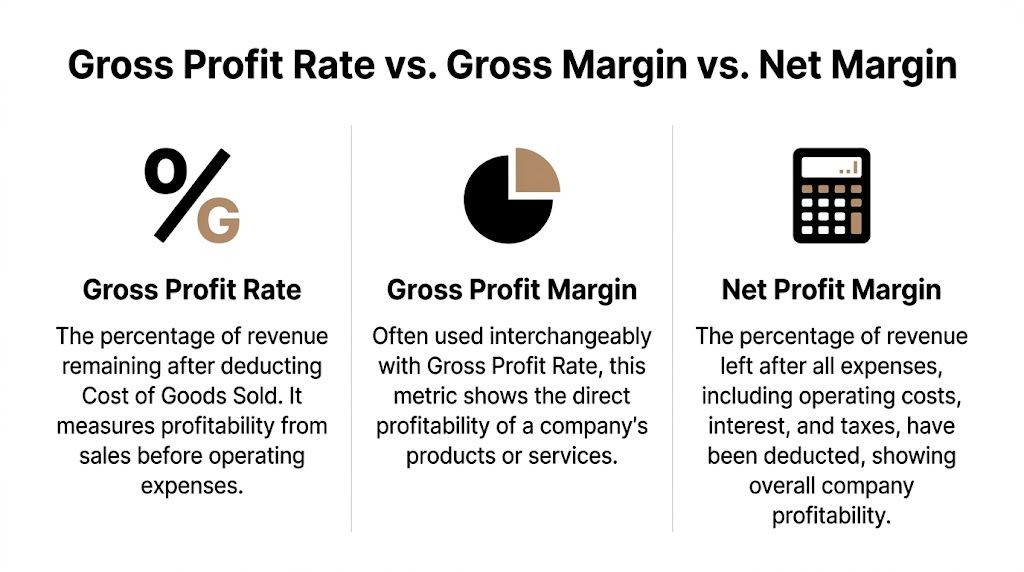
For most practical agency use, gross profit rate and gross profit margin mean the same thing. Both describe the percentage of revenue left after subtracting COGS.
You’ll see both labels in finance tools, blog posts, and reporting templates. The name matters less than the math. What matters is that everyone inside the business uses the same definition.
Net margin is a different question
Net profit margin goes further down the P&L. It accounts for all expenses, not just direct delivery cost. That includes overhead such as admin salaries, rent, software, sales, finance, interest, and taxes.
So the distinction is simple:
- Gross profit rate tells you whether the work itself is economically sound.
- Net margin tells you whether the business as a whole is profitable after everything else.
That’s why gross profit rate is often the better early warning signal for agency leaders. If delivery economics weaken, gross profit rate will usually show it before the final net result tells the full story.
When to use each metric
Use gross profit rate when you need to answer:
- Are we pricing this work well
- Is this client expensive to serve
- Is this team delivering efficiently
- Which service line should we grow
Use net margin when you need to answer:
- Can the business support its overhead
- Are we carrying too much fixed cost
- Did company-wide profitability improve
A lot of confusion disappears once you separate delivery health from business health. They connect, but they are not the same thing.
Making the data practical with automated time tracking
Most agencies don’t avoid project-level profitability because they dislike finance. They avoid it because the data collection is messy.
If time logs are late, vague, or padded from memory at the end of the week, your direct labor numbers won’t be solid enough to trust. And if direct labor isn’t trustworthy, your gross profit rate by project or client won’t be either.
Why manual timesheets break this process
Manual entry creates two problems at once. First, it lowers accuracy. Second, it creates team resistance, because people feel like they’re doing admin work for someone else’s spreadsheet.
A better setup captures work closer to when it happens. Calendar-based tracking, tagged meeting data, CRM-linked activity capture, and rule-based categorization all make it easier to see which hours belonged to which client, project, or service line.
That’s where tools built for agency operations help. Automated timesheet software for agencies can reduce the cleanup work needed to get usable delivery data into reporting. One example is TimeTackle, which connects calendars and work systems so teams can categorize time with less manual entry and review labor by project, client, or team.
Better inputs lead to better decisions
Once time data gets cleaner, you can finally do the work that matters:
- Review client profitability before renewal
- Catch scope creep before it becomes normal
- Compare team efficiency without guessing
- Decide whether to hire, reprice, or narrow an offer
Some agencies also lower direct delivery strain by moving admin and support work off the core team. If you’re exploring that route, a directory like Hire LatAm Virtual Assistants can help you think through which tasks should stay with billable specialists and which should shift elsewhere.
The point is simple. The gross profit rate equation only becomes useful when the underlying time and cost data are reliable enough to act on.
If your agency is still piecing together profitability from late timesheets and spreadsheet exports, TimeTackle is worth a look. It helps teams capture time from calendars and connected systems, categorize work with less manual effort, and report labor by client, project, or team so gross profit analysis becomes practical instead of theoretical.