



Most agency leaders know this feeling. Revenue looks fine on paper, the team is busy all week, clients keep sending new work, and yet you still can't answer basic questions with confidence. Which accounts are making money? Which team is carrying too much load? Where does non-billable time keep creeping in?
That gap is where performance benchmarking becomes useful. Not the lab-style version built for servers and chipsets, but the operational version that helps a service business measure how work really moves through the week. When you benchmark the right work patterns, you stop running the agency on instinct alone. You start seeing where margin slips, where staffing plans break, and where reporting habits create blind spots.
Are you flying blind on project profitability?
A common agency pattern looks healthy from the outside. The calendar is full. The Slack channels are noisy. Clients renew. Then finance closes the month and someone notices that one “great” account ate far more team time than expected, while another smaller client produced better margin with less friction.
That usually happens because the agency tracks effort loosely. People fill out timesheets late. Meeting-heavy work goes missing. Internal work gets lumped into generic admin buckets. By the time anyone reviews the numbers, the story is already distorted.
What this looks like in practice
One project manager sees a profitable client. The delivery lead sees a team that is always stretched. The COO sees rising payroll pressure without a clean reason why. They are all reacting to the same problem from different angles.
Scope creep often hides inside small calendar events, quick revisions, handoff meetings, status calls, and “just one more pass” requests. None of those feel dramatic in isolation, so they rarely trigger action. Put them together over a quarter and they change the economics of an account.
“Busy” isn't a performance metric. It's often a sign that your reporting model is too weak to separate productive work from expensive drift.
If you want better pricing, cleaner staffing decisions, and saner delivery plans, you need a baseline. That baseline starts with consistent tracking of where time goes, by client, by project, and by work type. Once you have that, performance benchmarking stops being abstract. It becomes a way to answer operating questions with evidence instead of debate.
The decisions benchmarking helps you make
A good benchmark system helps agency leaders answer questions such as:
- Which clients absorb the most unplanned work and keep pushing teams off schedule
- Which departments run near capacity while others still have room to take more delivery load
- Which projects look profitable at kickoff but lose margin during execution
- Which reporting habits hide the truth because people backfill hours from memory
- Which service lines deserve higher pricing because they create repeated coordination overhead
If project margin feels murky, a structured project profitability analysis approach is usually the fastest place to start. Not because it solves every operating problem, but because profitability forces the agency to connect time, staffing, delivery, and pricing in one view.
What performance benchmarking actually means for a service business
For an agency, performance benchmarking means comparing your current operating results against a clear standard so you can see what good looks like, what normal looks like, and where your process breaks down. It is less about raw activity and more about patterns you can repeat, compare, and improve.
The key words are repeatability and representativeness. The Standard Performance Evaluation Corporation says a valid benchmark needs those traits, and under identical conditions results should stay within a small variance such as ±2% so the data reflects actual performance instead of random noise (SPEC). That idea came from technical benchmarking, but it applies well to agency operations too. If your reporting process produces wildly different answers each month for the same kind of work, your benchmark is weak.
Three useful benchmark types
Agencies usually need three kinds of comparison.
Internal benchmarking compares teams, projects, or client segments inside your own business. This is the easiest place to begin because the data is yours, the service model is familiar, and you can spot uneven delivery habits quickly.
Competitive benchmarking compares your operation with what peer firms report publicly or discuss in industry circles. This is harder because outside data is often thin or framed for marketing, but it can still help with pricing, utilization expectations, and service design.
Strategic benchmarking borrows operating habits from top performers, even outside your niche. A consulting firm can learn from a bank's discipline in measuring turnaround time and process consistency. If you want a non-agency example of how benchmarking helps teams gain competitive advantage in banking, that perspective is worth reading because the logic transfers well.
What a solid benchmark looks like
A valid agency benchmark usually has four traits:
- Consistent inputs so meetings, project work, internal work, and client support are classified the same way every week
- Comparable units so you aren't judging a short advisory engagement against a long implementation rollout without context
- Stable collection methods so one team doesn't rely on memory while another tracks work in real time
- Clear decision use so every benchmark connects to pricing, staffing, delivery planning, or margin control
Practical rule: If a metric can't change a staffing, pricing, or delivery decision, don't build a benchmark around it.
That's why benchmarking in a service business should stay simple at first. You're not building a research lab. You're building an operating system for better choices.
The few agency KPIs that truly matter
Most agencies track too many numbers and trust the wrong ones. They report total hours, meeting counts, or broad utilization summaries that look tidy in a slide deck but don't explain what's hurting margin. The better approach is to track a short list of KPIs that link work patterns to financial outcomes.
This is the visual model I use when thinking about agency metrics.
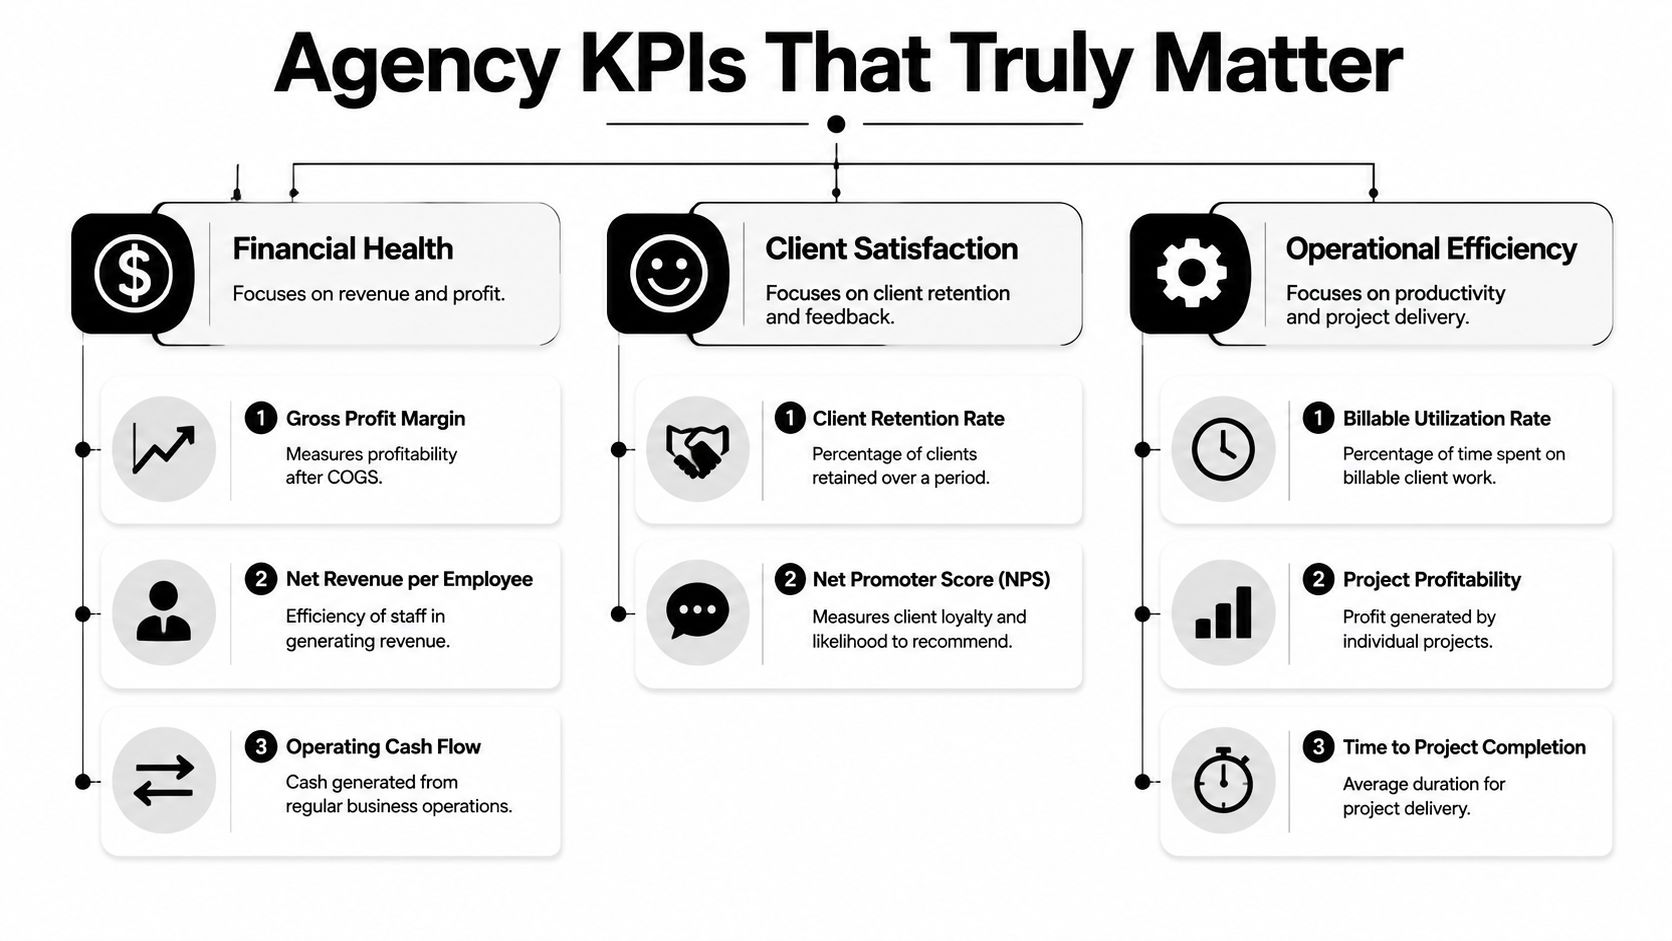
Start with the metrics that change decisions
Some metrics tell you whether the business is healthy. Others only tell you that people were active. Activity matters, but only if it connects to margin, retention, delivery speed, or staffing pressure.
| KPI Category | Metric | What It Measures |
|---|---|---|
| Financial health | Gross profit margin | Profit after direct delivery costs |
| Financial health | Net revenue per employee | How efficiently the team turns labor into revenue |
| Financial health | Operating cash flow | Cash generated through normal operations |
| Client satisfaction | Client retention rate | Whether clients stay over time |
| Client satisfaction | Net Promoter Score (NPS) | Client loyalty and referral intent |
| Operational efficiency | Billable utilization rate | Share of time spent on client work |
| Operational efficiency | Project profitability | Margin by project or account |
| Operational efficiency | Time to project completion | Delivery speed from kickoff to finish |
What these KPIs tell you
Billable utilization rate tells you whether paid client work is taking enough of the week to support your model. If it falls, the issue may be low demand, too much internal coordination, poor role design, or messy planning.
Project profitability is where hidden effort shows up. A project can hit the deadline and still be weak because the team spent too much time in revisions, internal review loops, or client management.
Net revenue per employee gives you a blunt but useful view of operational efficiency. It won't explain the cause on its own, but it can tell you whether team structure and service mix are moving in the right direction.
Client retention rate matters because delivery problems often show up here before they appear anywhere else. Clients don't always complain loudly. They reduce scope, delay renewals, or stop asking for strategic work.
For teams that want cleaner reporting habits around these metrics, SleekPost's reporting guide has useful advice on keeping reports readable and decision-focused.
Why vanity metrics fail
Agencies often overvalue metrics like hours logged, number of meetings, or task volume. Those numbers can rise while the business gets less efficient.
A better frame is this:
- Track margin-linked metrics because they expose where delivery costs drift
- Track workload distribution because burnout usually begins as uneven allocation, not dramatic overtime
- Track completion patterns because delayed work creates both staffing and client risk
- Track client continuity because recurring friction tends to surface there first
If you need a stronger starting set, this collection of professional services metrics is a good reference because it keeps the focus on operating signals that managers can act on.
A practical benchmarking workflow you can actually follow
A lot of benchmarking efforts fail for one simple reason. Teams try to measure everything at once, then drown in cleanup work. A better method is to build a repeatable process that starts narrow, cleans the data, and only then expands.
This is the workflow I recommend for agency operations.
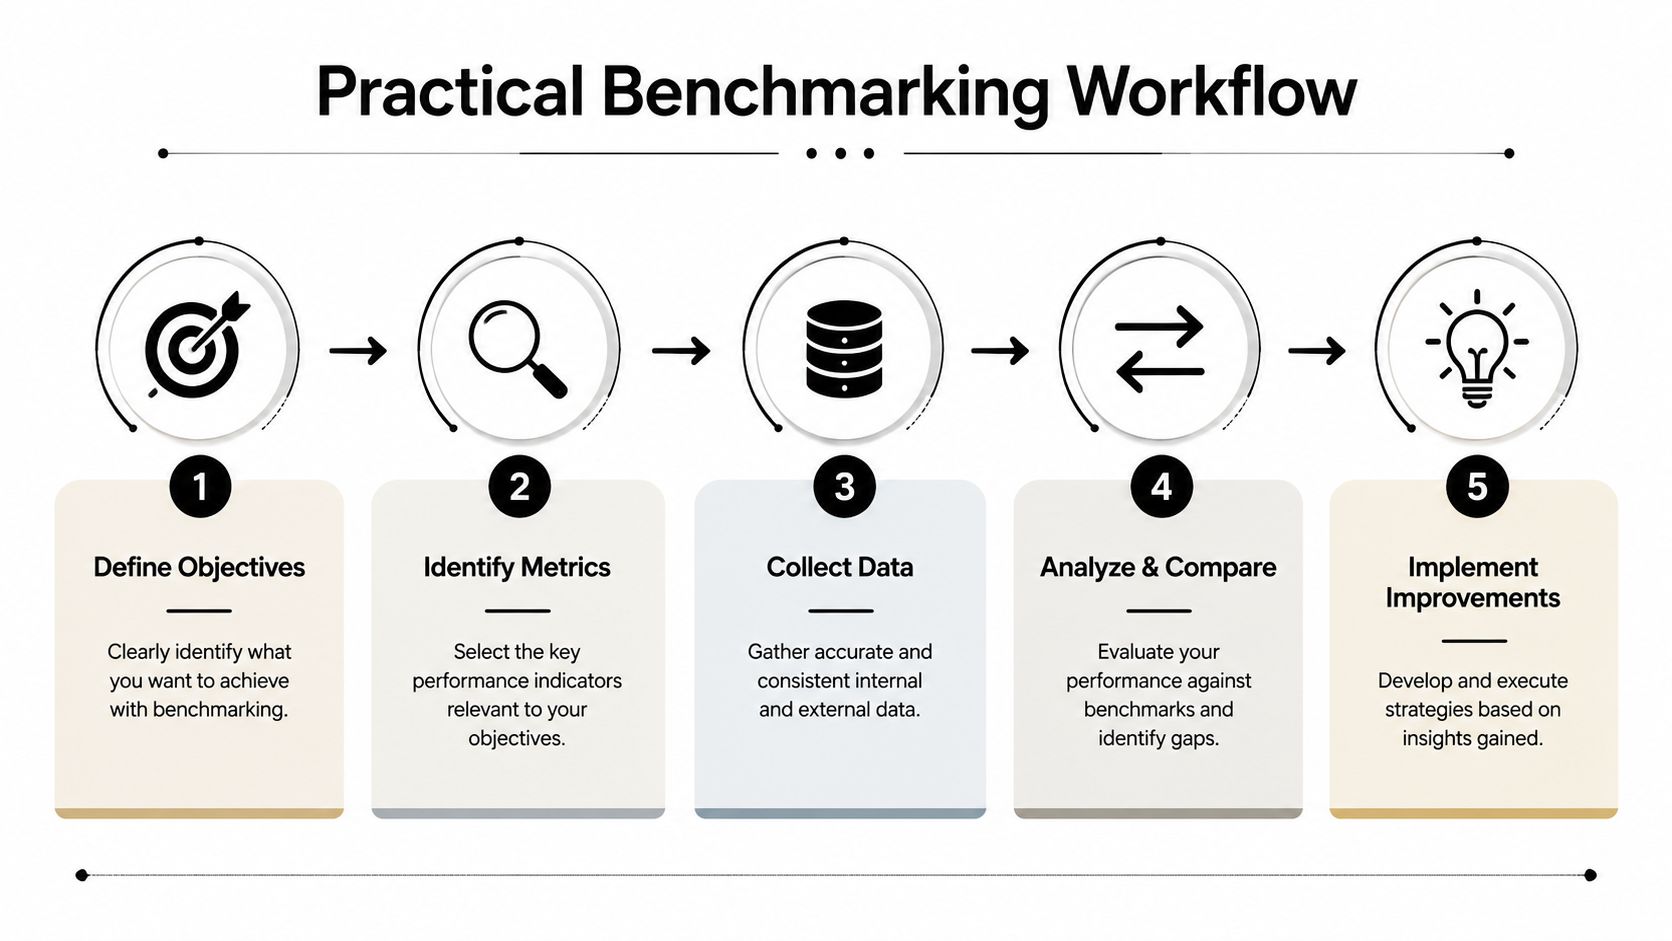
Step 1 and step 2
Start with one question that matters. Don't ask, “How is the agency performing?” Ask, “Which client segment creates the most unplanned non-billable load?” or “Why do similar projects finish with different margins?”
Then choose the smallest set of metrics that can answer it. One profitability metric, one workload metric, and one delivery metric is often enough for a first pass.
Step 3 and step 4
Collect the data in a consistent way, then normalize it before you compare anything. This step matters more than many realize. A retainer account, a fixed-fee website build, and a long implementation program generate very different work patterns. If you compare them without context, the benchmark is misleading.
For benchmark data to hold up, statistical discipline matters. A stable environment should keep the Coefficient of Variation below 5%, and best practice often calls for at least 100 data points or test runs to support reliable analysis (Application Architect). That guidance comes from software benchmarking, but the lesson translates well to operations. Don't build agency benchmarks from thin, erratic samples.
Small samples create loud opinions and weak conclusions.
After collection, group like with like. Compare similar project types, similar roles, and similar client arrangements. Otherwise you'll confuse structural differences with performance differences.
Step 5
Once the data is clean, look for the gap between current behavior and your working standard. That doesn't always mean “best team wins.” Sometimes the top-performing team has easier accounts, cleaner briefs, or less approval friction.
Use a simple workflow like this:
- Define the target area. Pick one high-impact operating question.
- Choose clean metrics. Use only the few numbers needed to answer it.
- Collect enough observations. Give the benchmark enough volume to be believable.
- Normalize the comparisons. Separate project types, account models, and team structures.
- Set a realistic next target. Use the gap to guide action, not to punish teams.
What realistic targets look like
Good targets are specific enough to guide action and modest enough that teams believe them. If your benchmark says account managers spend too much time in internal status meetings, the right response may be tighter meeting rules, better templates, or cleaner approvals. It probably isn't “work harder.”
That's the point of performance benchmarking in an agency. It should make work more understandable, not more bureaucratic.
Automate your benchmarking with calendar data
Manual time collection is where most agency benchmark systems start to break. People forget entries, batch-log work at the end of the week, or round time in ways that make reports look cleaner than reality. Then leaders build dashboards on top of that shaky data and wonder why the conclusions feel off.
The problem isn't that timesheets are evil. The problem is that memory is weak, and agencies ask busy people to reconstruct fragmented days after the fact.
Why manual tracking keeps failing
A strategist might spend a day moving between client calls, proposal work, internal reviews, and ad hoc support. By Friday afternoon, those blocks blur together. The timesheet gets filled anyway, but the detail is weaker, the categories are rougher, and small pockets of real work disappear.
That creates three problems at once:
- Billing integrity drops because client-facing effort gets undercounted or misassigned
- Resource planning gets fuzzy because managers can't see how capacity is being used
- Benchmarks lose trust because nobody believes the source data is complete
There's another issue. Many guides ignore the gap between polished vendor numbers and operating reality. Industry data says vendor benchmarks can overstate performance by 20%, which leaves agency leaders without a clear way to validate telemetry against actual workflow friction (Sparkco).
Why calendar-based capture is a better foundation
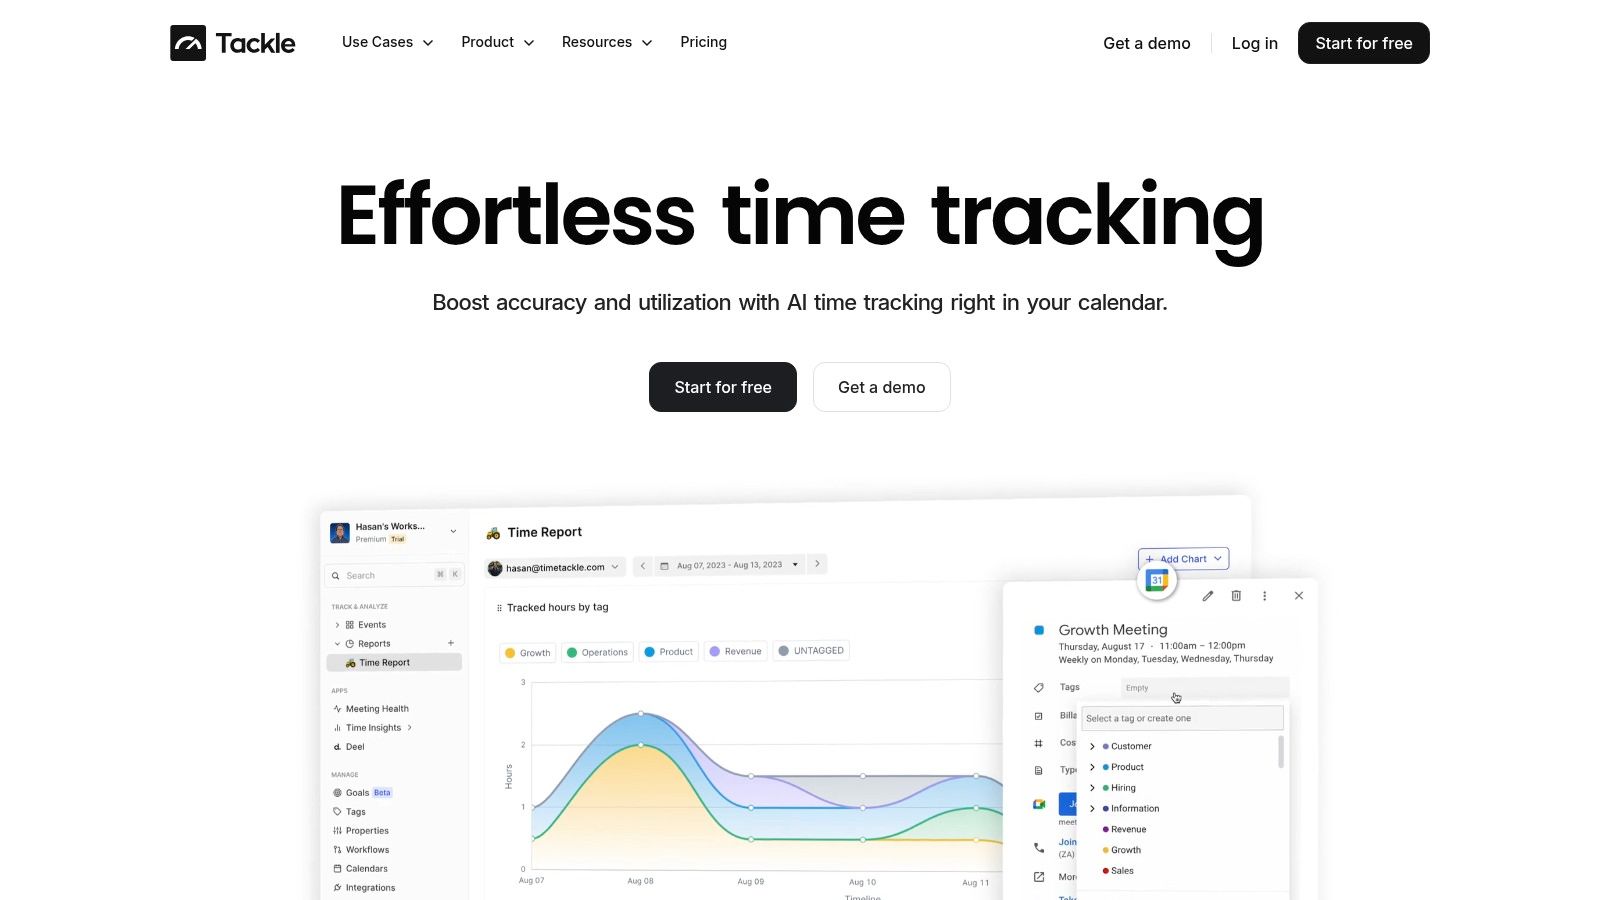
Calendar data won't capture every minute of deep work on its own, but it gives agencies something manual timesheets rarely provide: an objective activity spine. Meetings, calls, reviews, planning sessions, client check-ins, and handoffs already live in Google Calendar or Outlook. That means you can start from recorded behavior instead of memory.
Once you connect calendar events to projects, clients, and work types, a cleaner benchmark system becomes possible. Tagging rules can sort recurring meetings. Properties can separate billable from non-billable work. Dashboards can show workload by team, client, and service line without waiting for end-of-month spreadsheet cleanup.
What automation makes possible
When agencies automate collection and categorization, the reporting conversation changes. Instead of asking people to justify their week from scratch, operations leaders can review patterns that already exist and investigate the exceptions.
That makes it easier to see:
- Accounts with hidden coordination costs because meeting load is much higher than expected
- Teams with recurring overhead pressure because internal events keep crowding out billable work
- Projects with delivery drag because review cycles and rework sessions keep stacking up
- Managers with planning issues because calendars show constant rescheduling and fragmented allocation
Automated benchmarking works because it lowers the cost of honesty. The less effort people spend reconstructing work, the more reliable the operating picture becomes.
For agencies trying to move from anecdotal reporting to dependable performance benchmarking, calendar-driven data is often the missing layer.
Common benchmarking pitfalls and how to avoid them
Bad benchmarks usually come from good intentions. A team wants more visibility, so it starts measuring everything. Then the data gets noisy, comparisons get sloppy, and the dashboard turns into a collection of charts nobody trusts.

Four mistakes that distort the picture
The first trap is relying on averages alone. Technical benchmarking guidance recommends reporting p50, p95, and p99 together, because a wide gap between p50 and p99 shows a long tail of poor performance that the average hides (RadView). In agency terms, your average project may look fine while a smaller group of projects creates most of the chaos.
The second trap is comparing work that isn't comparable. A strategic retainer, a one-off creative sprint, and a long implementation project do not behave the same way. If you benchmark them together, you'll punish the wrong teams and miss the actual constraint.
The third trap is treating benchmarking as a quarterly event. That leads to forensic reporting. Leaders look backward, explain what happened, and move on without changing day-to-day management.
The fourth trap is setting targets that sound ambitious but ignore how the work actually gets done. Teams stop taking the benchmark seriously when it feels detached from reality.
Better habits to use instead
A stronger approach looks like this:
- Use distribution, not just averages so you can spot projects or clients that create unusual drag
- Split benchmarks by work model so comparisons stay fair across retainers, fixed-fee work, and advisory projects
- Review trends often because small weekly checks catch problems before they hit margin
- Set targets with context so managers can connect them to staffing, planning, or process changes
One warning: If a benchmark mainly exists to pressure people harder, the data quality will drop fast because the team will start managing the metric instead of the work.
Benchmarks should improve judgment. When they become a blunt control tool, they stop telling the truth.
Your first dashboard and next steps
Your first dashboard doesn't need to be big. It needs to be trusted. Start with one page that gives leadership a clean weekly read on workload, margin pressure, and delivery drag.
A simple first dashboard
Include these views:
- Overall billable utilization by team or department
- Top client accounts by project profitability so weak-margin work becomes visible
- Non-billable time breakdown by internal meetings, admin, and business development
- Delivery trend view showing which projects keep slipping or absorbing extra coordination time
Keep the filters simple. Team, client, project type, and date range is enough for a first version. If the dashboard answers real operating questions every week, people will use it. If it tries to explain the whole business at once, they won't.
A good next step is to review examples of a performance dashboard for service teams and then build only the version your managers will open. Start small, keep the data clean, and let the benchmark earn trust through repeated use.
If your agency is stuck in timesheet cleanup and spreadsheet reporting, TimeTackle gives you a cleaner way to capture work from calendar activity, categorize it automatically, and turn it into reporting your ops team can use. It's a practical fit for agencies that want better utilization visibility, stronger billing accuracy, and less manual reporting overhead.