



Your team is flat out. Calendars are packed. Slack never stops. Project leads say everyone's working hard, and they are.
Then you look at profit and feel that familiar drop in your stomach.
That gap between effort and outcome is where most agency reporting breaks down. People track activity, but they don't track the few numbers that tell them whether the work is turning into paid revenue, healthy cash flow, and solid margins. That's why professional services metrics matter. Not because leaders need more dashboards, but because they need a clean read on what's going on.
Are you busy or are you profitable
A lot of firms hit the same wall. Delivery teams are overloaded, account managers are asking for more capacity, and leadership assumes the business must be doing well because everyone looks busy. Then month-end closes, and the numbers don't back it up.

I've seen this happen when a team spends long days in client meetings, revisions, internal handoffs, and admin, but only part of that time ever makes it onto an invoice. The firm feels productive. The calendar says the team is at capacity. Finance sees something else entirely.
That's usually when leaders start pulling on the wrong lever. They ask people to work faster, push for more work in, or tighten payroll. Sometimes those moves help. Often they make things worse because the problem sits in measurement, not effort.
You can't fix a margin problem if your reporting still treats busyness as success.
A small set of professional services metrics provides clarity amidst the noise. You need to know how much time is billable, how much billed time gets paid, how long it takes to collect cash, and whether the mix of work leaves room for profit. If those numbers are fuzzy, every planning decision gets weaker.
Profit also isn't just an operations issue. Tax treatment, entity setup, and cash planning shape what you keep after the work is done, which is why practical guidance on tax planning for businesses belongs in the same conversation as delivery metrics.
The foundation of operational efficiency metrics
A team can look fully loaded on paper and still miss its margin target by a wide margin. I see it when calendars are packed, timesheets are thin, and write-offs show up at month end. The problem is not effort. The problem is the gap between what people worked, what got recorded, and what clients accepted and paid for.
The three numbers that expose the gap
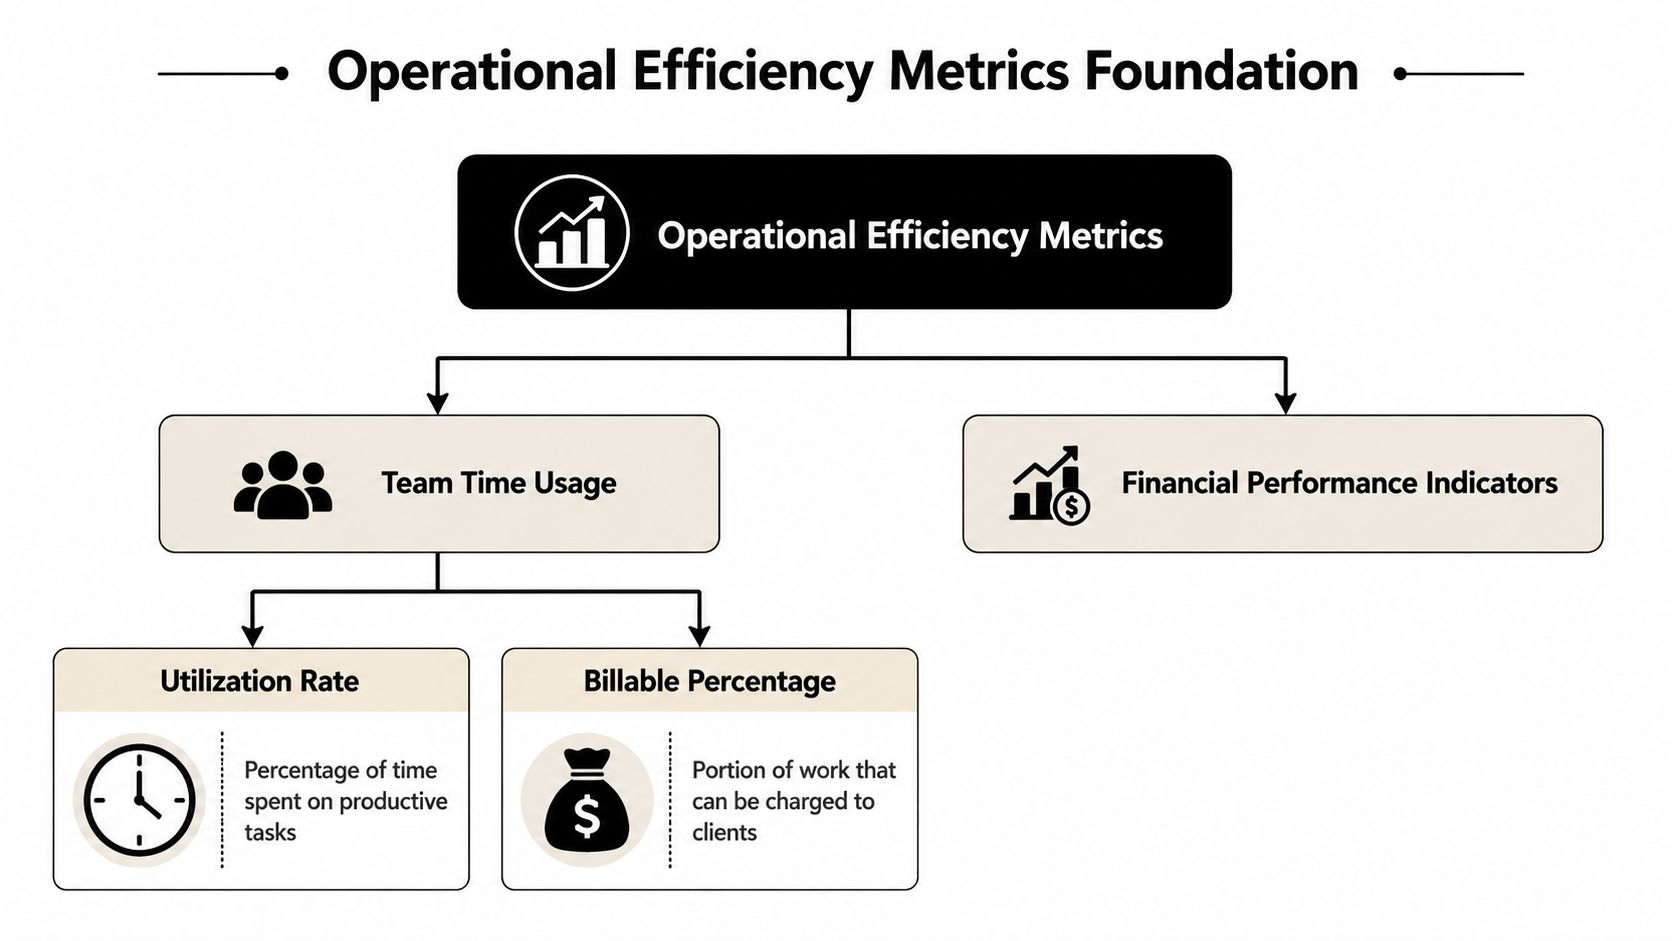
Start with utilization rate. The formula is simple: billable hours divided by total hours worked, multiplied by 100. The Project Management Institute's overview of professional services metrics uses utilization as a core delivery measure because it shows how much team capacity is pointed at revenue-generating work rather than internal activity or overhead.
Then look at forecasted utilization. This is scheduled billable hours divided by available hours. Operations teams use it to spot upcoming delivery pressure, bench time, and staffing mismatches before they turn into missed deadlines or rushed hiring.
The third metric is realization rate, the share of recorded billable time that turns into collectible revenue after write-downs, discounts, and client pushback. The Association of International Certified Professional Accountants points to realization as a key profitability measure in service firms because recorded hours mean very little if they do not survive review and billing.
These three metrics belong together. Separating them is how firms fool themselves.
A delivery lead may report strong utilization while finance is writing off a meaningful share of the same hours. Sales may keep feeding work into the schedule, which makes forecasted utilization look healthy, even though the work was scoped too loosely to hold margin. That is why measuring operational efficiency across time, capacity, and output matters more than watching a single dashboard number.
Why utilization on its own is a weak management metric
Utilization is useful, but it is easy to overvalue because it looks clean. It rewards activity. Profitability depends on conversion.
Here is the operational reality:
| Metric | What it shows | What it misses on its own |
|---|---|---|
| Utilization | How much worked time was marked billable | Whether the hours were captured completely and billed cleanly |
| Forecasted utilization | What capacity looks like in the coming weeks | Whether upcoming work is scoped and staffed at the right level |
| Realization | How much recorded billable time became paid revenue | Whether the team used the right people and the right amount of effort |
That gap is where margin disappears.
I have seen account teams celebrate an 80% utilization month while realization dropped because senior staff spent hours in unplanned reviews, client calls were never logged, and PMs cleaned up timesheets at the end of the week from memory. Nobody was idle. The firm still lost money.
Where the gap starts
In most agencies, the gap comes from operating habits, not bad intent:
- Scope drift: Extra rounds, extra calls, and “quick fixes” stay outside the statement of work.
- Late or manual time entry: People reconstruct their week from memory and miss short meetings, prep time, and follow-up.
- Poor staffing discipline: Senior people step in to rescue work that should have stayed with lower-cost delivery roles.
- Disconnected reporting: Delivery, finance, and leadership work from different definitions of billable time and project status.
Manual capture is the biggest blind spot because it distorts both sides of the equation. It lowers utilization when worked time never reaches the timesheet. It lowers realization when vague or backfilled entries create billing disputes.
Automated calendar capture closes a large part of that gap. When meetings, working sessions, and client touchpoints are captured as they happen, teams stop relying on memory. Finance gets cleaner records. Project leads can see where time is going before the month closes. Leadership gets a truer view of whether a busy team is producing paid work or just producing effort.
That operating discipline also supports broader planning. Firms that want better control over margins, cash, and owner returns should pair delivery metrics with practical strategies for SME financial growth.
Measuring financial health and profitability
A team can post full calendars, hit delivery deadlines, and still miss its profit target for the quarter. I have seen that happen when utilization looked fine on paper, but realization slipped, write-offs climbed, and invoices went out with weak detail that clients pushed back on.
That is why financial metrics matter. They show whether the hours you captured turned into revenue, margin, and cash.
Start with gross project margin
Project profitability is easiest to manage at the gross margin level: revenue minus direct delivery cost, measured against revenue. The Project Management Institute's overview of project cost management makes the same practical point. Cost performance has to be measured against actual delivery, not optimistic plans or status-call sentiment.
Margin is where the metric gaps finally show up in dollars. A team may look productive because calendars are packed and utilization is high. If a chunk of that time never makes it into billable records, or gets written down because entries are vague, realization falls and margin follows it.
That trade-off matters in real agency work. A senior strategist jumping into a delivery problem may save the client relationship. It can also erase the job's profit if that intervention was never priced into the work. Leadership can choose that on purpose. It should not discover it after close.
Watch cash conversion, not just booked revenue
Revenue on the P&L does not fund payroll. Cash does.
I pay close attention to days sales outstanding, invoice approval delays, and how often finance has to rebuild an invoice before it can go out cleanly. Those are not back-office nuisance metrics. They usually point to operational gaps upstream.
Here is the pattern I see most often:
- Margin looks acceptable, but cash lags: invoicing is late, client approvals are stuck, or collections are slipping
- Invoices get revised too often: time entries are incomplete, project codes are wrong, or supporting detail is too thin
- Realization drops before anyone notices: meetings, prep time, and follow-up work happened, but they were not captured clearly enough to bill with confidence
Automated calendar capture helps here because it improves the source record before finance inherits the mess. When client meetings and working sessions are logged in real time, project managers have better support for billing, and finance spends less time translating half-remembered activity into invoice language.
Backlog gives context to the numbers
Backlog is committed work you have sold but not yet delivered. On its own, it is a planning metric. Next to margin and cash metrics, it becomes a profitability signal.
A healthy backlog with weak project margin usually means the sales engine is working but delivery economics are off. Thin backlog with decent margins creates a different problem. The firm is profitable on current work but exposed if new projects do not land fast enough. Both situations need action, but not the same action.
I review these metrics together because one metric alone can hide the problem.
| Financial metric | What good looks like | What usually needs attention |
|---|---|---|
| Gross project margin | Work leaves room after direct delivery costs | Overservicing, bad staffing mix, write-downs |
| Backlog | Near-term revenue is visible enough to staff calmly | Hiring and resourcing are running on guesswork |
| DSO | Invoices turn into cash in a reasonable cycle | Billing delays, weak approvals, slow-paying clients |
| Invoice rework | Finance can bill from clean records the first time | Manual cleanup, missing time, unclear project detail |
For finance teams that want a wider management view, this overview of strategies for SME financial growth is a helpful companion to delivery-side reporting.
If you want cleaner profit reporting, tighten your process for calculating utilization rate and read it beside realization, margin, and DSO. That is how you spot the gap between people being busy and the firm getting paid well for the work.
Tracking client health and future growth
Past margin matters, but it won't tell you whether next quarter gets easier or harder. For that, you need client health metrics.
The forward-looking view
The three I care about most are client churn rate, net revenue retention, and net promoter score. I'm not interested in them because they look good in a board deck. I'm interested in them because they tell you whether your current client base is getting deeper, flatter, or weaker.
A project can finish with a decent margin and still leave behind a damaged account. Maybe communication was messy. Maybe delivery was fine but too hard to buy from. Maybe the team solved the wrong problem. Those issues rarely show up in project accounting right away, but they show up later when renewals shrink, referrals stop, or expansion never lands.
What each metric adds
Client churn rate is the simplest warning sign. If clients leave after delivery or fail to renew, something in the value chain broke. It may be service quality. It may be onboarding. It may be that you sold work your team couldn't deliver cleanly.
Net revenue retention gives a stronger signal than churn on its own because it asks a better question. Are existing clients spending more, less, or about the same over time? That one gets to the heart of account quality. If the work creates real value, good clients usually stay and widen the relationship.
Net promoter score has limits. Plenty of firms overuse it or ask at the wrong moment. Still, if you collect it with discipline and compare it with account growth, it can help you spot whether your “happy” clients buy more.
A client that pays on time, renews, and expands is worth more than a “satisfied” client who never deepens the relationship.
What works in practice
I'd rather see leaders run a tight monthly review with account leads than build a bloated client-success scorecard nobody trusts. Keep it grounded:
- Renewal risk: Which accounts are quiet, delayed, or increasingly reactive?
- Growth signal: Which clients are asking for broader support, faster access, or more senior input?
- Experience signal: Where do complaints repeat, even if the project still closes?
- Dependency check: Which accounts take more effort than their revenue justifies?
This is one of the most profitable habits an agency can build because existing clients are easier to understand than new ones. You already know their team, buying process, and service history. If the relationship is healthy, growth is cheaper and more predictable. If it's unhealthy, no new business pipeline fixes that for long.
How to automate data collection and reporting
The hard part of professional services metrics isn't choosing the metrics. It's collecting data without wasting everyone's time.
Manual timesheets are the usual failure point. People hate filling them out. They do them late. They guess. They round. They forget short calls, prep time, follow-ups, internal reviews, and all the small bits of work that add up across a week. Then managers spend more time cleaning reports than using them.
Why manual entry keeps creating gaps
The reporting gap usually starts with innocent behavior. A strategist jumps from a client workshop into internal planning, then into a sales call, then into revisions. By Friday, nobody remembers the exact split. So they estimate.
That estimate might be “good enough” for payroll. It's not good enough for profitability. Once those fuzzy entries roll into billing, realization drops, invoice detail gets weaker, and finance has less confidence in what can be charged.
The worst part is cultural. Teams start seeing time tracking as admin theatre instead of operational data. When that happens, compliance gets worse and trust in the numbers goes with it.
What automated calendar capture changes
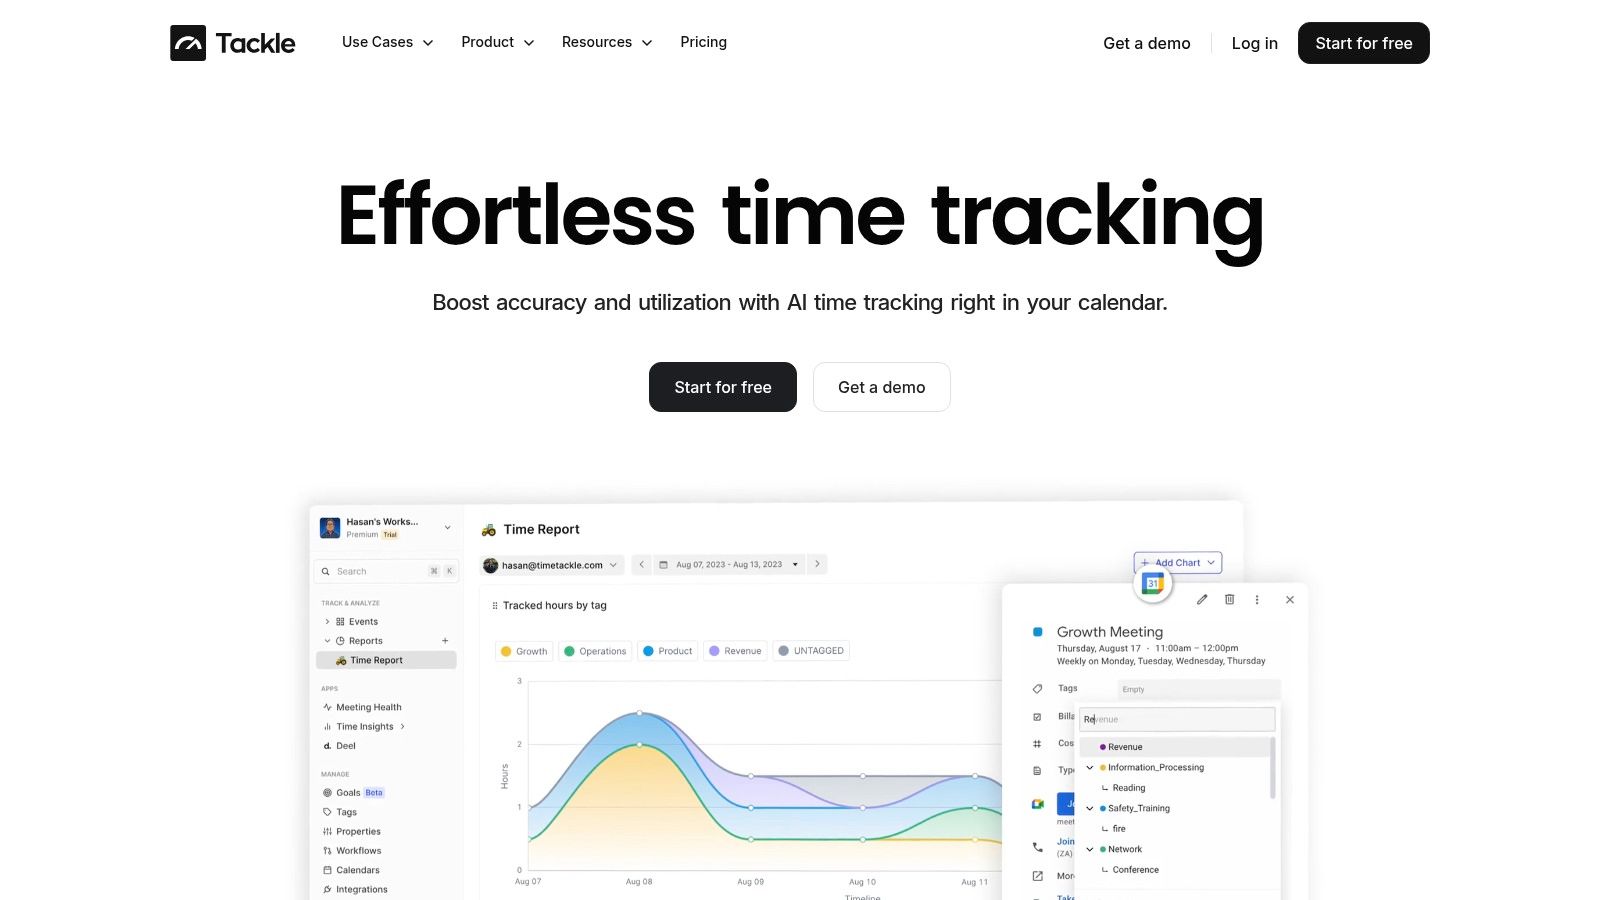
A better approach is to capture work from the systems people already use, especially Google Calendar and Outlook, then map that activity to clients, projects, and categories. Calendar-based tracking won't solve every reporting problem, but it removes a major source of friction because it starts with actual activity instead of memory.
That matters for a few reasons:
- Coverage improves: meetings, prep blocks, and client follow-ups are less likely to disappear
- Entries get cleaner: project and client tags can be applied more consistently
- Managers review instead of chase: they spend less time asking people to update old timesheets
- Billing gets stronger: invoice detail can reflect the work with better accuracy
One option in this category is TimeTackle, which connects Google or Outlook calendars and CRMs to automatically capture activities, apply custom tags and rules, and surface utilization and reporting views by client, project, team, or opportunity. That kind of setup is useful when the goal is less manual entry and better reporting discipline, not just another timer app.
Good automation doesn't replace management. It gives managers cleaner evidence.
How to roll it out without annoying the team
The mistake I see most often is forcing a new tracking process onto everyone at once with no cleanup first. That usually creates noise.
Do this instead:
- Fix your taxonomy first. Decide what counts as billable, non-billable, internal, pre-sales, and client success work.
- Map calendars to real work types. Don't just capture meetings. Tag them to projects, accounts, and delivery stages.
- Set review habits. Team leads should review exceptions, odd patterns, and uncategorized activity every week.
- Connect reporting to action. If the report doesn't change staffing, scope, billing, or pricing decisions, nobody will care.
- Keep exports simple. Finance, delivery, and leadership need different cuts of the same data, not separate reporting universes.
If you're trying to move from static spreadsheets to live reporting, this page on automated reporting software gives a practical picture of what that workflow can look like.
Actionable ways to improve your key metrics
Monday looks full. The team's calendars are packed, projects are active, and the pipeline says demand is healthy. Then month-end closes and margin is thin, invoices are challenged, and senior staff spent too much of the week on work no client will pay for. That gap is where firms lose profit.
Improve utilization without burning people out
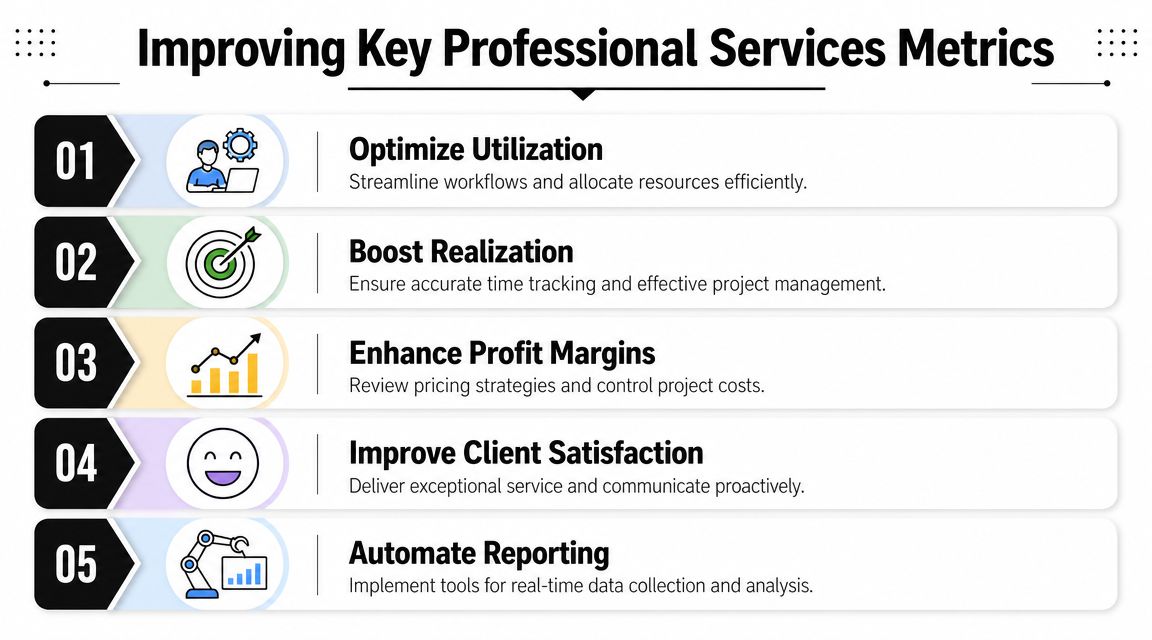
Utilization gets better when work is assigned cleanly, not when people are pushed harder. A team can post high utilization and still miss margin if too much time sits with the wrong level of seniority or too much of it ends up written off.
Start with the mismatch between scheduled work and actual work. If senior strategists keep showing up in status calls, QA reviews, and preventable rework, utilization may look healthy while realization drops.
A few fixes usually have immediate effect:
- Rework staffing assumptions: Compare planned effort with calendar-captured delivery patterns. Then re-estimate based on what the work really takes.
- Move work down to the right level: Protect senior time for decisions, client risk, and high-value problem solving.
- Cut meeting load that does not change delivery: Recurring internal meetings often hide the biggest pool of recoverable capacity.
- Review utilization next to realization: A busy team is only useful if those hours survive billing.
Raise realization by tightening scope and proof of work
Realization improves before the invoice goes out. It improves when scope is clear, changes are documented, and the team can show what happened without rebuilding the month from memory.
That is where firms often see the gap between timesheets and reality. A consultant may spend three extra hours in client calls, Slack follow-up, and internal problem-solving tied to that account, but if those activities are logged late or not tagged correctly, finance has weak support for the bill.
Use a tighter operating standard:
- Set revision limits in the SOW
- Flag scope drift every week
- Require change requests before extra work becomes normal
- Make time descriptions specific enough for a client to recognize the value
- Check calendar activity against logged time on large accounts
If the team cannot explain an hour in plain language, finance usually cannot defend it.
Protect margin through service mix
Margin pressure often comes from the type of work sold, not just how efficiently it is delivered. Labor-heavy execution with frequent revisions, vague approvals, and heavy senior oversight will keep margins under pressure even if utilization looks strong.
By contrast, firms usually get more control from structured retainers, fixed-scope recurring work, and advisory services where the value comes from judgment rather than production volume. Rework notes this pattern in its professional services metrics resource: https://resources.rework.com/libraries/professional-services-growth/professional-services-metrics.
The practical question is simple. Which services create the largest gap between effort consumed and revenue collected?
I review margin by service line, then compare that to the calendar footprint required to deliver it. If one offering absorbs senior attention, creates lots of unplanned meetings, and still produces average fees, it needs a pricing change, a process change, or a hard decision about whether to keep selling it.
Improve cash collection by fixing the handoff to finance
Cash collection gets worse when delivery, account management, and finance operate from different versions of the work. The invoice goes out late, support is incomplete, or the client disputes descriptions that should have been cleaned up before billing.
A simple billing checklist solves a lot of this:
- Confirm all time is categorized before invoice prep
- Validate project codes and purchase order details early
- Resolve client-facing descriptions before finance drafts the invoice
- Assign one owner for final invoice review
- Track disputes by reason so repeated billing errors get fixed at the source
This is another place where metric gaps matter. If realization is weak and DSO is stretching, the issue may not be collections alone. It may be poor operational evidence upstream.
Build one reporting rhythm that leads to action
Weekly reviews should catch capacity shifts, scope drift, and accounts that are consuming more time than planned. Monthly reviews should test margin quality, write-offs, billing delays, and collection risk. Quarterly reviews should examine whether the current client and service mix still support the profit target.
What matters is consistency. Teams improve faster when leaders review the same metrics in the same order and ask the same follow-up questions each cycle.
The strongest reporting setups also close the gap between calendar activity, delivery records, and finance data. When those sources line up, managers can see whether a utilization problem is really a staffing issue, a realization issue, or a pricing issue. That is how metrics become operational decisions instead of dashboard decoration.
Moving from data to strategic decisions
A services firm can hit its utilization target and still miss its profit target by a wide margin. I have seen teams celebrate full calendars while write-offs rise, invoices stall, and account margins slide. The problem was never a lack of activity. It was the gap between activity, billability, and what clients would pay for.
That gap is where strategic decisions either get sharper or go wrong.
Strong operators do not look at utilization, realization, margin, cash timing, and client health as separate scorecards. They look for the distance between them. If consultants are busy but realization is soft, pricing, scope control, or time classification is off. If realization looks healthy but margin is weak, delivery costs or seniority mix may be wrong. If margin is fine on paper but cash is late, the client may be a growth risk long before renewal talks start.
Calendar-based activity capture matters because it closes the first gap, the one between work performed and work recorded. Once that gap shrinks, the rest of the picture gets harder to ignore. Leaders can see whether the business has a capacity problem, a commercial problem, or an execution problem. Those are very different decisions, and they require different fixes.
The firms that improve fastest are usually not tracking more metrics. They are reducing disagreement between the systems behind those metrics, then using that cleaner view to make earlier calls on staffing, pricing, account management, and service mix.
If you want cleaner reporting without dragging your team through more timesheet admin, TimeTackle is worth a look. It uses calendar-based activity capture, tagging, and reporting workflows to make utilization, client work, and operational patterns easier to see and easier to act on.