By the time most agency leaders decide to fix reporting, the damage is already familiar. Project managers are chasing missing timesheets. Ops is cleaning exports from four systems that don’t agree with each other. Finance gets a utilization report on Monday that was already wrong on Friday.
That weekly scramble has a cost. It slows billing, makes staffing decisions harder, and wears people down because nobody wants to spend their best hours reconciling spreadsheets. The good news is that this problem is fixable, but only if you treat reporting as an operational workflow, not just a dashboard project.
The end of the reporting fire drill
Sunday night reporting work is one of those agency habits that feels normal until you step back and look at it. Someone exports time data from one system, project status from another, and revenue or invoice data from a third. Then they patch the gaps in Sheets or Excel, send a version around for review, and hope nobody notices the formula that broke when a new client was added.
That’s not a reporting process. It’s manual reconciliation with nicer formatting.
The shift away from that model is already underway. The global automation software market was valued at USD 22 billion in 2023 and is projected to grow at a 16.79% CAGR from 2024 to 2031, driven by businesses trying to cut manual overhead and run more efficiently, according to StartUs Insights’ automation software market report.
For agency operators, that matters because reporting is rarely a standalone problem. It sits inside a bigger stack of approvals, handoffs, task routing, and data movement. If you’re sorting out the full process, this guide to workflow automation software is useful context because reporting usually breaks where the workflow around it breaks.
Why the old way keeps failing
Manual reporting usually falls apart for the same reasons:
- Too many systems: Client work lives across calendars, CRMs, project tools, billing systems, and ad platforms.
- Too much judgment: People have to remember what was billable, what belonged to which client, and how to classify internal work.
- Too many handoffs: Every export, cleanup step, and approval round adds delay and error.
Most teams don’t have a reporting problem first. They have a capture problem, then a classification problem, and only then a reporting problem.
That’s why a lot of BI rollouts disappoint agency teams. The dashboard might look polished, but the data feeding it is still late, incomplete, or manually patched. A prettier report doesn’t fix bad collection.
A better setup starts earlier. It captures work where it already happens, applies rules automatically, and gives leaders a live view of utilization, delivery, and margin without waiting for someone to “finish the report.” If you want to see that idea in an agency-specific context, TimeTackle’s guide to marketing agency reporting is a practical example of how reporting changes when calendar and work data are connected from the start.
What changes when you automate the right layer
Good automated reporting software doesn’t just save analyst time. It changes the rhythm of the week. Operations stops chasing inputs. Project leads stop debating whose spreadsheet is correct. Finance gets cleaner billing data earlier.
And team morale improves because people stop doing work that feels pointless.
What automated reporting actually means for your agency
A lot of teams think automated reporting means “the dashboard emails itself every Monday.” That’s only the delivery step. If the data behind that dashboard still depends on exports, copy-paste work, and manual fixes, the reporting is not really automated.
Automated reporting software is a connected system that pulls data from the tools your team already uses, applies rules to organize it, updates reports without manual prep, and sends the right view to the right people.

The difference between display and automation
Teams often get tripped up. A BI tool can display data beautifully, but it may still rely on someone to clean source data first. A scheduled PDF can arrive on time every week, but that doesn’t mean the numbers were captured correctly.
Real automation covers the full chain:
- Data capture from calendars, CRMs, project tools, finance systems, or ad platforms
- Classification through rules, tags, mappings, and defaults
- Aggregation into dashboards, summaries, and stakeholder views
- Distribution by email, shared links, exports, or downstream syncs
If any one of those stages still depends on routine manual work, the process is only partly automated.
What that looks like in practice
In a healthy setup, a client call on a team member’s Google Calendar becomes structured reporting data. The system recognizes the client, applies a tag, marks the work category, and makes that activity available for utilization and billing views. Nobody retypes the meeting into a timesheet later.
That’s a very different model from the usual one:
| Approach | What happens |
|---|---|
| Manual reporting | Staff export data, clean it by hand, rebuild formulas, and send static reports |
| Basic dashboarding | A dashboard shows data, but the source prep still happens manually |
| Full reporting automation | Data is captured, organized, updated, and delivered with minimal human effort |
The test is simple. If your ops lead goes on vacation, does the reporting still run cleanly? If not, you probably have reporting theater, not reporting automation.
Why agencies need a broader definition
Agencies have a harder reporting problem than many other businesses because the data is messy by default. You’re tracking people, clients, projects, internal work, sales support, and revenue signals at the same time. A generic dashboard won’t fix that unless it can handle the activity layer where work begins.
That’s why the strongest systems connect to behavioral data, not just business summaries. Calendars matter. CRM activity matters. Project status changes matter. Once those inputs flow automatically, reports stop being a backward-looking admin task and start becoming an operating system for the week.
Core features that solve real agency problems
Software demos usually focus on broad terms like “dashboards,” “integrations,” and “custom reports.” Those labels are too vague to help an agency buy well. The better question is this: what real problem does the feature remove?
For most mid-sized agencies, the first problem is not reporting format. It’s bad time capture.
Calendar-driven capture beats manual timesheets
Most reporting guides miss the role of calendar data. That’s a mistake, because agencies don’t usually fail at making charts. They fail at getting accurate effort data into the system without annoying everyone involved.
Industry data cited by Unito’s automated reporting tools guide says 70% of mid-sized firms underreport utilization by 15-25% because they rely on manual timesheet entry. That gap matters because every utilization report, staffing decision, and margin review sits on top of those inputs.
If your team fills out timesheets from memory, you already know the pattern. Monday is incomplete. Tuesday gets guessed. Friday gets rushed. Client-facing work is often remembered better than internal prep, follow-up, or fragmented support work, which means your data is skewed before anyone opens a dashboard.
The better feature to look for is calendar-based time capture. It pulls from Google or Outlook, gives the team a draft of what occurred, and reduces the memory problem that kills timesheet accuracy.
Rule-based tagging is where the real value shows up
Once activity is captured, the next make-or-break feature is how the tool classifies it. Many systems fall short here. They can collect data, but they can’t map it cleanly to the business.
You want rules that can answer questions like:
- Client mapping: If the meeting title contains a client name or account code, assign it automatically.
- Billable logic: If the event is linked to a delivery project, mark it billable unless an exclusion rule applies.
- Work type sorting: Separate delivery, internal admin, sales support, recruiting, and leadership work without asking people to recategorize every line item.
That’s the difference between activity data and useful management data.
For teams trying to reduce admin overhead from the source, automated timesheet software is usually a better category to explore than generic reporting tools, because the reporting only gets better when time capture gets easier and more accurate.
Features that matter more than they sound
A few features sound minor in demos but have outsized impact after rollout.
- Editable audit trail: Teams need to fix edge cases without breaking trust in the system.
- Flexible filters: Leaders will ask for views by client, team, project, role, or opportunity. If filters are rigid, people go back to spreadsheets.
- Live syncing: Reporting loses value fast when teams wait on batch updates or manual refreshes.
- Export control: Finance and ops still need clean handoffs to CSV, Sheets, PDF, or downstream systems.
Buy the feature that removes repeated labor, not the feature that looks impressive in a sales call.
One practical way to judge feature quality
Ask each vendor to show one workflow end to end. Not just a dashboard. Ask them to show how a real calendar event becomes categorized time, then becomes utilization reporting, then becomes an export or invoice input.
If they can only show polished dashboards, but not the messy middle, you’re looking at presentation software more than operational software.
One option in this category is TimeTackle, which connects calendar and CRM activity, applies tags and rules, and turns that data into flexible reports and dashboards. That kind of setup is useful when the agency’s biggest issue is not chart design but getting clean activity data into the reporting layer without constant follow-up.
Four automated workflows that change everything
Tuesday, 4:45 p.m. A department lead wants current utilization before approving two new client requests. In agencies that still depend on manual timesheets, nobody can answer with confidence until Friday or Monday. In agencies that automate reporting around calendar activity, the answer is already there.
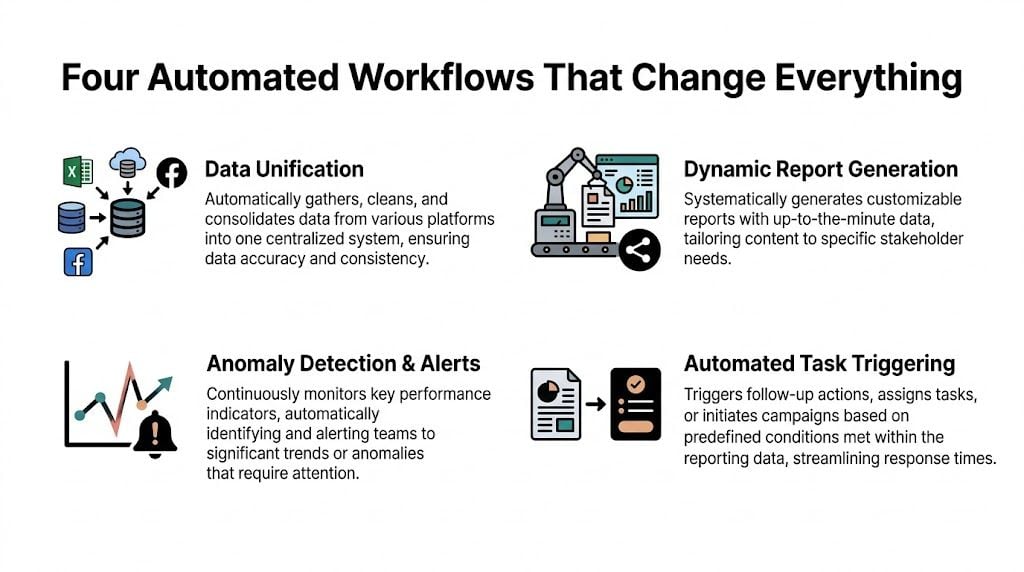
Workflow one captures time without the weekly chase
A strategist joins a client planning call at 10:00 a.m. The meeting is already in Google Calendar. The reporting system pulls the event, reads the title or linked CRM record, tags it to the right client, and applies the right work category.
That changes more than data entry.
Teams stop rebuilding their week from memory. Ops stops sending Friday reminders. Managers get fewer vague entries like "client work" and more usable records tied to the actual meeting, account, and service line. For mid-sized agencies, this is usually the point where reporting gets easier because time capture finally fits how people already work.
The trade-off is setup discipline. Calendar-based automation only works well if naming rules, client mappings, and exceptions are configured properly. Get that right, and timesheet fatigue drops fast.
Workflow two updates utilization while the week is still happening
Once meeting data is categorized, it can feed utilization reporting in near real time. Billable status, role, team, and client are already attached, so capacity stops being a backward-looking estimate.
That matters because staffing mistakes are expensive. A team can be overloaded for three days before anyone notices in a manual process. Senior staff can absorb unplanned client work that never shows up clearly until month-end. By then, the damage is already in the margin.
A useful live view answers practical questions:
- Who is over capacity today
- Which clients are consuming unplanned senior time
- Where non-billable meetings are growing
- Which teams have room for new work this week
Agencies that want stronger reporting usually do not need more dashboards first. They need cleaner activity data flowing into the dashboards they already review. That is the operational point behind modern BI engineering. Good reporting depends on reliable upstream systems, not just better chart design.
Workflow three builds the client report from live sources
Client reporting is where agencies typically burn a lot of account management time. Status notes live in one tool, campaign data in another, and work logs somewhere else. Someone pulls it all together every Friday, then repeats the same process next week.
A better workflow pulls approved data from connected systems on a set schedule and formats a draft report automatically. The account manager still adds context, risks, and recommendations. Software handles the repetitive assembly work.
That division of labor is what works in practice. Full automation often produces sterile reports that clients do not trust. Manual reporting keeps nuance but wastes hours. The middle ground works better. Automation prepares the first version, and the account team improves it.
If the agency is trying to cut repeated admin across reporting, handoffs, and follow-ups, this guide on how to automate repetitive tasks is useful because the reporting burden usually comes from repeated small actions, not one broken process.
Workflow four moves clean time data into finance
The last workflow is where reporting starts affecting cash flow. Once time data is categorized and approved, finance can use it for invoice preparation, margin review, and reconciliation without cleaning up a pile of late entries first.
Many agencies experience the payoff. Billing goes out faster. Finance spends less time chasing corrections. Project leads trust the numbers more because they reflect actual activity captured during the week, not reconstructed estimates entered days later.
The implementation challenge is approval design. Finance needs controls. Delivery teams need a process that does not slow them down. The best setups keep the approval path short, flag exceptions clearly, and pass only clean records downstream.
Done right, these four workflows replace the reporting fire drill with a system that runs in the background. That improves reporting accuracy, protects margin, and removes a weekly source of frustration for both ops and delivery teams.
A practical checklist for choosing the right software
A lot of agencies buy software based on demo polish and feature volume. Then the rollout stalls, users avoid it, and the team gradually returns to Sheets. That pattern is common enough that tool selection needs to start with operational fit, not product marketing.
That matters even more because manual reporting still takes too much team time. A 2026 Domo report, cited by Oak Hill Financial Services, says manual reporting consumes 40% of an agency analyst’s time, while 30% of implementations are abandoned in the first 90 days, and 65% of mid-sized agencies revert to spreadsheets because templates don’t fit how they work.
Use this checklist before you buy
| Evaluation Criteria | What to Look For | Red Flag |
|---|---|---|
| Data capture | Direct connections to calendars, CRM, and other core systems | Relies on CSV uploads or repeated manual imports |
| Ease of setup | Non-technical users can map fields, tags, and report views | Vendor says your admin team will “pick it up later” |
| Workflow flexibility | Rules can handle your naming habits, client structures, and billable logic | Only rigid templates with limited customization |
| Report usefulness | Reports answer staffing, utilization, margin, and billing questions | The tool produces pretty charts with no operational use |
| User adoption | Team members can review and correct data without much training | Heavy dependence on one analyst or one ops person |
| Downstream value | Clean exports or syncs into finance and planning workflows | Reporting lives in its own silo |
Questions that expose real fit
During evaluation, ask vendors to show the awkward parts. Those are the parts that decide whether the tool survives past kickoff.
- Can project managers change a report without asking an analyst for help?
- Can the system read calendar activity and map it to clients or projects?
- How does it handle exceptions, corrections, and approval steps?
- What does the first useful report look like, and how long does it take to get there?
You’re not trying to buy maximum power. You’re trying to buy a system your team will actively use.
Don’t confuse BI maturity with operational readiness
A lot of agency leaders know they need better analytics, so they start shopping broad BI platforms. Sometimes that’s right, but often it’s too much tool for the actual problem. If you’re thinking about the wider data stack and team structure around reporting, this guide to modern BI engineering gives useful context on what a more mature reporting environment requires.
The wrong software doesn’t fail because it lacks features. It fails because normal people can’t keep it running without extra work.
That’s the standard to use in demos. Ask whether the tool reduces administrative load or instead transfers that load from one person to another.
Common pitfalls that sink reporting projects
Most failed reporting projects don’t fail at purchase. They fail after purchase, when real agency data hits the system and the team discovers how much manual cleanup still sits between raw inputs and reliable reporting.

Pitfall one buys complexity the team can’t absorb
Mid-sized agencies often buy like enterprises and operate like lean service teams. That mismatch hurts adoption. If a system assumes dedicated admins, data engineers, or long implementation cycles, the burden lands on operations and project leads who already have full-time jobs.
The result is predictable. Reports get built by one or two experts. Everyone else waits for them. The business becomes dependent on a tiny internal support desk.
Pitfall two ignores the integration mess
Data integration is where a lot of automation plans hit reality. Client names are inconsistent across systems. CRM records don’t match project codes. Calendar titles are human-written, which means they’re useful but messy.
According to ReportDash’s automated reporting article, incompatible data formats across platforms can cause a 30-50% loss of actionable intelligence. The same source says effective API-driven automation can reduce integration errors by 70-80% and prevent report delays that inflate manual reconciliation costs by 40%.
Those numbers track with what agency teams experience. If source systems don’t map cleanly, the dashboard may still render, but the insight quality drops fast. You get a chart that looks finished and a decision that’s still based on doubt.
Pitfall three treats user behavior as an afterthought
Teams don’t resist automation because they dislike efficiency. They resist systems that create extra review work, force them into rigid categories, or make them feel monitored without giving them anything useful back.
That’s why calendar-based capture works better than many manual logging models. It starts from activity the team already created. People review and correct, rather than rebuild from scratch.
A practical rollout usually includes:
- Clear tagging rules: People need to know how the system classifies work.
- Light review steps: Staff should confirm and adjust, not re-enter everything.
- Manager visibility: Team leads need views that support staffing or scope control.
- A short exception path: Weird cases happen. The process needs a clean way to fix them.
Bad implementations ask teams to do more admin in the name of reducing admin.
Pitfall four automates reports without fixing ownership
If nobody owns source quality, report quality drifts. If nobody owns rule updates, client changes and new service lines create silent errors. And if nobody owns adoption, the tool becomes “something ops uses” instead of part of the agency’s operating rhythm.
The fix is not heavy governance. It’s clear ownership. One person owns taxonomy. One person owns system health. Team leads own review discipline. Finance or operations owns downstream reconciliation.
That structure is boring, which is why it works.
How to measure success and calculate your ROI
If you want to justify automated reporting software internally, start with labor savings, billing accuracy, and decision speed. Don’t make the case with vague promises. Make it with before-and-after operational metrics your team can verify.
Track the inputs that matter
Look at four measures first:
- Reporting hours saved: Count how much weekly analyst, ops, and manager time used to go into collecting, cleaning, and formatting reports.
- Time capture quality: Compare missing entries, late entries, and correction volume before and after rollout.
- Billing confidence: Watch for fewer invoice disputes, fewer write-down conversations, and faster invoice preparation.
- Utilization visibility: Measure whether leaders can see team capacity and client effort early enough to act on it.
You don’t need a complicated model at the start. If the team saves recurring hours every week and captures work more accurately, the return usually becomes obvious quickly.
Connect operational gains to financial value
A simple ROI model works well:
| Area | What to compare |
|---|---|
| Labor | Hours spent building reports before and after automation |
| Revenue capture | Previously missed or delayed billable work now captured in time |
| Cash flow | Faster invoice readiness and fewer reconciliation delays |
| Management efficiency | Less time spent debating data quality in delivery and finance reviews |
The strongest business case usually combines hard and soft returns. Hard returns come from fewer manual hours and cleaner invoicing. Soft returns come from better morale, fewer Friday chases, and less distrust in reporting.
If your current reporting process depends on memory, spreadsheets, and heroics, the bar for improvement is not very high. You don’t need perfection. You need a system the team can trust and keep using.
If your agency is trying to get out of spreadsheet cleanup mode, TimeTackle is worth a look. It uses calendar-based time capture, rule-based tagging, and flexible reporting to turn day-to-day activity into cleaner utilization, billing, and productivity insight without asking teams to rebuild their week by hand.