Your agency probably has this problem right now.
One team is overloaded and slipping. Another has gaps in the week that never show up in the forecast. Finance asks whether a major account is making money, and the answer depends on which spreadsheet you trust. People feel busy all the time, but the numbers still don't explain margin, burnout, or why staffing always feels reactive.
I've seen that pattern enough times to know what it means. You don't have a work ethic problem. You have a visibility problem.
Most agencies try to fix it by pushing harder on timesheets, setting bigger utilization targets, or asking managers to “plan better.” That rarely works for long. An effective solution is resource utilization optimization built around actual capacity, actual work, and actual trade-offs. That means seeing what people are doing, what they could be doing, and what work should never have been assigned to them in the first place.
The end of just being busy
A lot of firms mistake movement for control.
The designer working late looks committed. The consultant who is booked solid looks productive. The account lead hopping between internal check-ins, client calls, and status updates looks indispensable. Then month-end arrives and nobody can say, with confidence, which team ran clean, which client absorbed too much senior time, or who is one week away from burning out.
That's the point where “busy” stops being useful as a management concept.
The agencies that get out of this loop stop treating utilization as a rough vibe and start treating it as an operating system. They track capacity at the team level, they separate billable work from admin load, and they stop pretending that a full calendar means a healthy business. If you need a clean definition to anchor the discussion, this explanation of resource utilization is a useful starting point.
What chaos usually looks like
It rarely shows up as one obvious failure. It shows up as several smaller ones at once:
- Uneven loading: One team works nights while another waits for approvals or staffing.
- Margin blur: Finance sees revenue, but delivery leaders can't connect effort to project profit.
- Planning by gut: Managers assign work based on memory, noise, or who seems “free.”
- People risk: Strong performers absorb the mess because they're reliable, which makes them the first people to leave.
Busy teams can still be badly allocated teams.
The shift that matters is simple to say and harder to do. Stop asking, “How do we keep everyone fully occupied?” Start asking, “How do we assign the right work, to the right people, at the right load, without wrecking quality or retention?”
That's when utilization becomes useful. Not as a pressure tool, but as a control system for profit and sustainability.
What to measure before you manage
If your numbers are fuzzy, your staffing decisions will be fuzzy too.
Most agencies track hours after the fact and call that visibility. It isn't. Good resource utilization optimization starts with a small set of metrics that tell you whether people are doing revenue-generating work, whether they have real capacity left, and whether your staffing model is creating cost problems.
Here's the visual model I use when I explain this to delivery leaders:
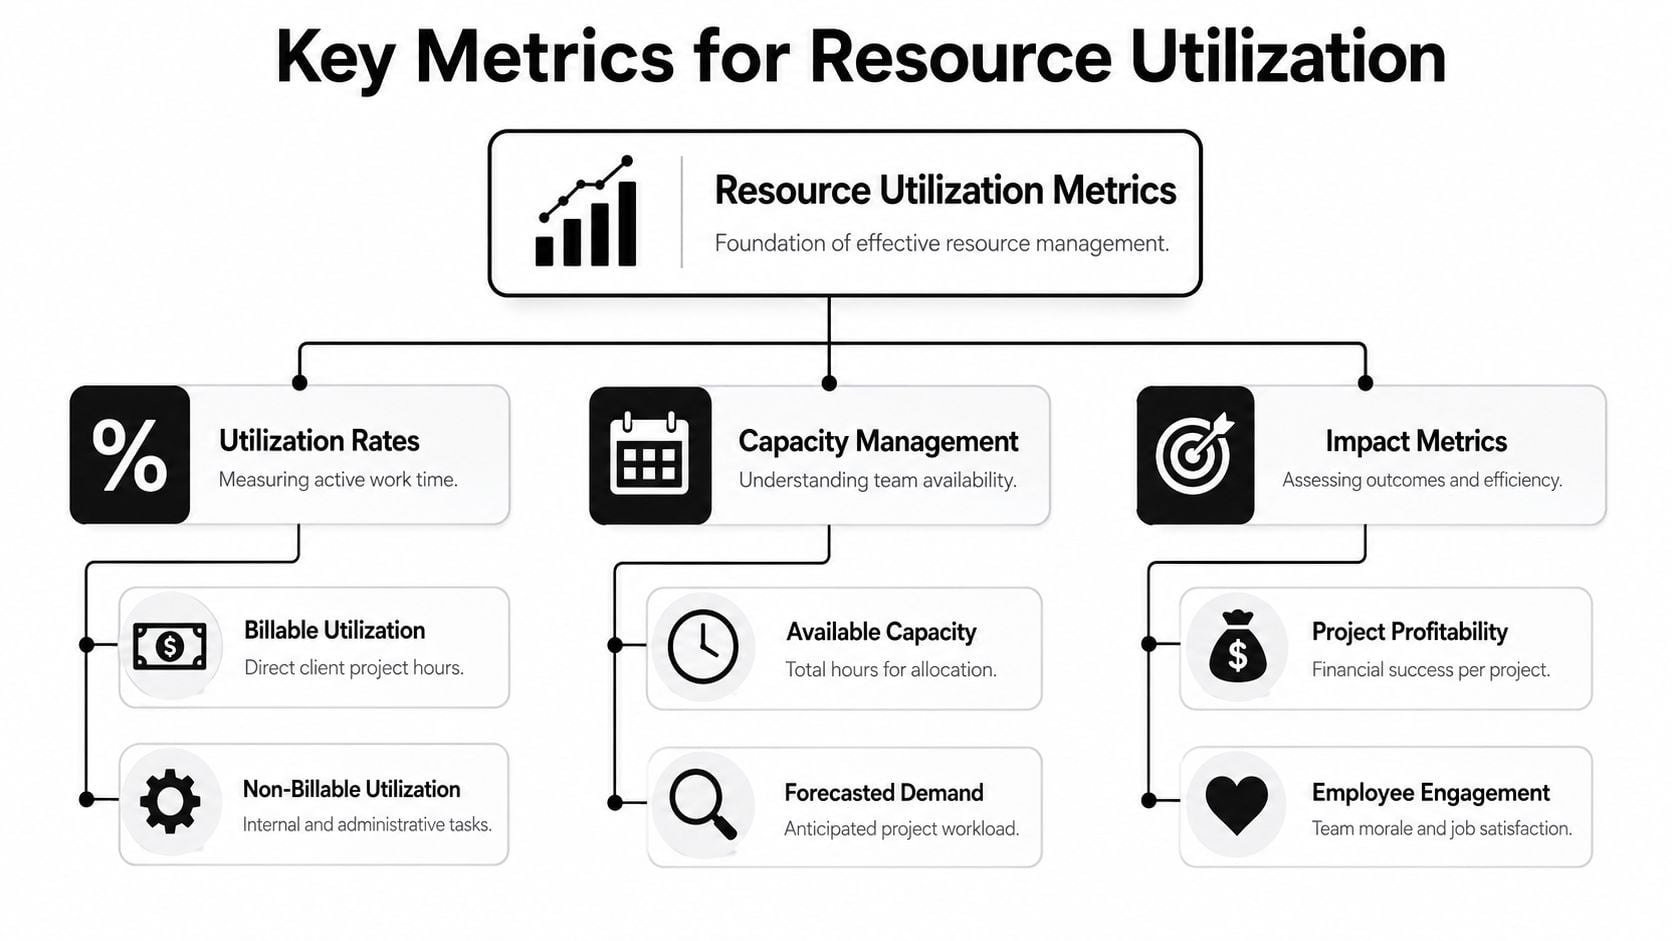
Start with utilization rate
The core formula is straightforward. Utilization Rate = (Billable Hours / Available Hours) × 100. If you want a practical walkthrough, this guide to calculating utilization rate breaks it down clearly.
That number tells you how much of someone's workable time goes to client work. It does not tell you whether the work was assigned well, priced well, or profitable. That's where a lot of teams get misled. They see a high utilization number and assume the operation is healthy.
It may not be.
Add cost variance or you'll miss the real problem
The second number matters just as much. Resource Cost Variance = (Actual Resource Cost – Planned Resource Cost) / Planned Resource Cost.
When you track both at once, you stop confusing busyness with efficiency. The verified benchmark is clear: “The key is to track both Utilization Rate = (Billable Hours / Available Hours) × 100 and Resource Cost Variance = (Actual Resource Cost – Planned Resource Cost) / Planned Resource Cost. Agencies using this dual-axis monitoring respond 20% faster to resource bottlenecks.”
That's the difference between asking “Are people full?” and asking “Are we staffing this work in a way that protects margin?”
Practical rule: If utilization rises and cost variance rises with it, your system is under strain, not improving.
Separate billable time from non-billable time
Leaders often treat non-billable work as noise. That's a mistake.
Internal reviews, QA, training, pre-sales support, project setup, handoffs, and coordination work all consume capacity. If you ignore them, your model will overstate how much delivery time the team has. Then managers over-assign work, deadlines slip, and the team gets blamed for a planning error.
A simple operating view looks like this:
| Metric | What it tells you | Why it matters |
|---|---|---|
| Billable utilization | Time spent on client-funded work | Tracks revenue-producing capacity |
| Non-billable load | Time spent on internal or support work | Shows what's eating delivery time |
| Available capacity | Real workable time left after leave and existing commitments | Prevents overbooking |
| Cost variance | Whether staffing matched the plan financially | Protects project margin |
Know the difference between availability and capacity
This sounds small, but it changes planning.
Someone may be “available” on paper because they have open calendar blocks. That does not mean they have capacity for deep work, client calls, revisions, and internal overhead. Capacity is the amount of meaningful work they can take on without quality slipping.
When managers skip that distinction, they create false confidence in the plan. The spreadsheet says the week is open. The person living that week knows it isn't.
Good measurement fixes that. It gives you an honest baseline, which is the only place optimization can start.
Why 100 percent utilization is a trap
A lot of bad agency behavior starts with a target that sounds sensible in a board meeting.
“Why aren't we aiming for full utilization?” Because people aren't machines, project work isn't linear, and professional services quality falls apart when every hour is pre-sold.
The strongest benchmark on this point is still the one most operators come back to. Gartner identifies a 70–80% billable utilization rate as the industry “sweet spot,” and the same verified source notes that going beyond it correlates with increased error rates, reduced code quality, and higher employee turnover in creative and technical agencies (Source 3).
That should change how leaders read a full schedule.
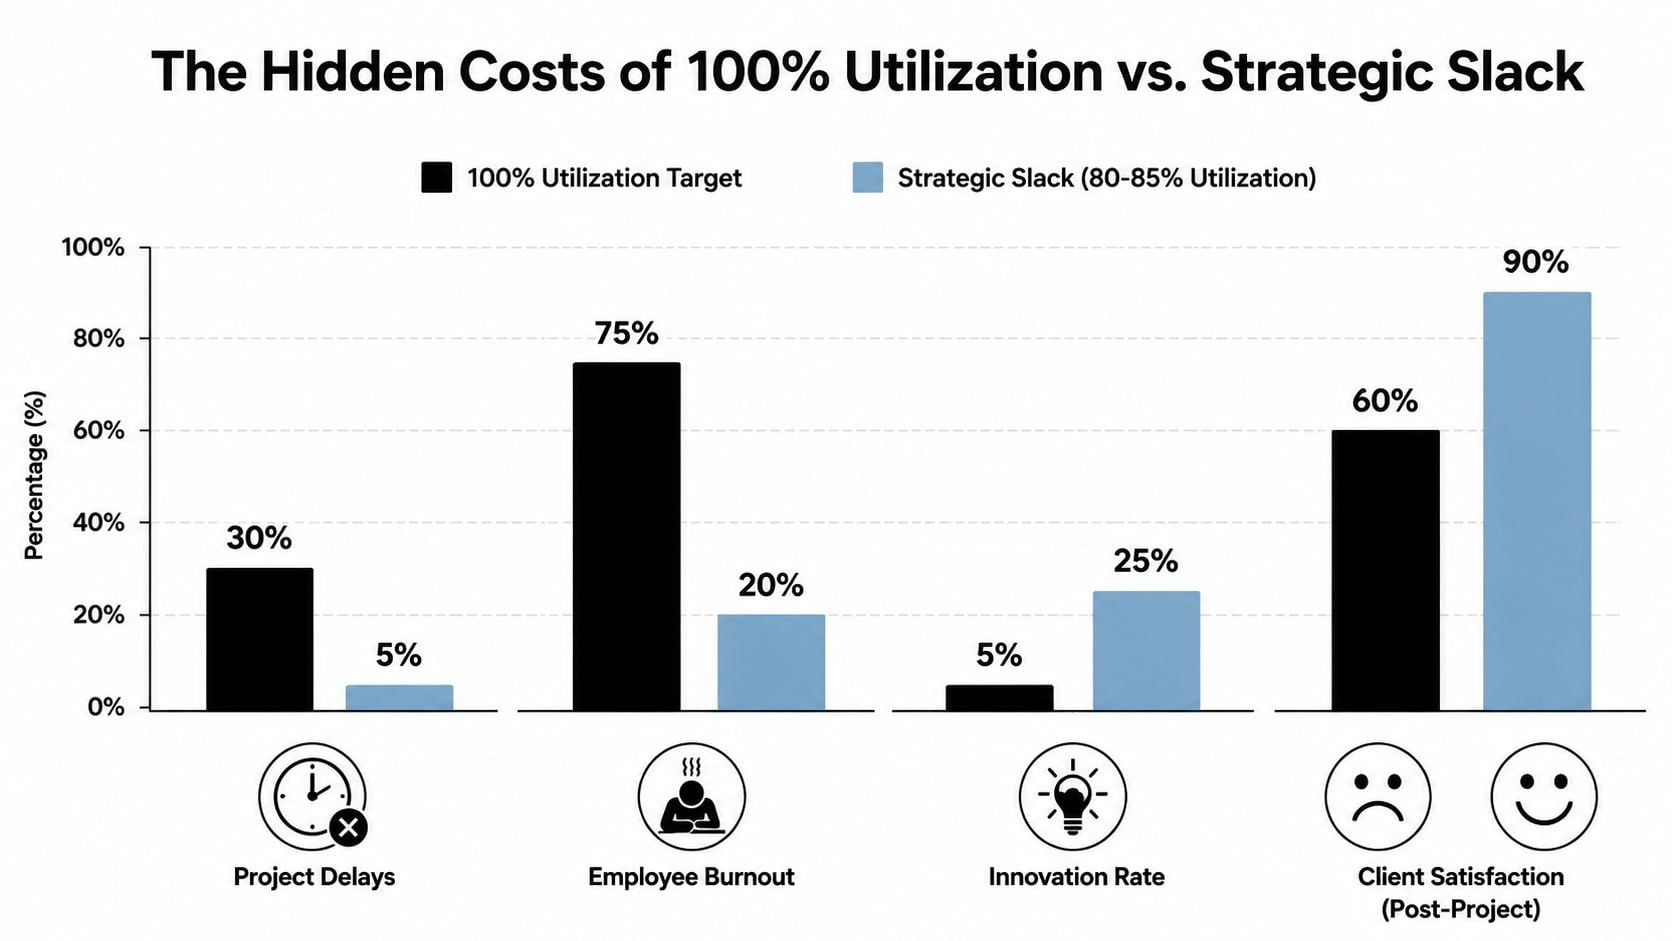
The utilization paradox
The trap is easy to describe. As utilization climbs, output rises for a while. Then rework, delays, missed details, and stress start to eat the gains.
One verified finding gets right to the point: agencies with utilization rates between 75–85% reported 22% higher client satisfaction and 18% lower burnout rates than those targeting 95–100% (Source 5). That gap is what many firms miss. They optimize calendars and damage delivery.
I've found that leaders resist this at first because slack feels wasteful. But strategic slack isn't waste. It's where review time lives. It's where problem-solving lives. It's where an urgent client request fits without blowing up the week.
What strategic slack actually does
A healthy team needs space for work that doesn't fit neatly into a task estimate.
- Absorbs volatility: Scope changes, client feedback, and internal dependencies don't disappear because the plan says they should.
- Protects quality: Teams catch errors earlier when they're not rushing from one booked hour to the next.
- Reduces people risk: Recovery time lowers the odds that your most capable staff become your most exhausted staff.
- Leaves room for better thinking: Some of the highest-value work in agencies is judgment, not output volume.
If every person is booked to the edge, your system has no shock absorber.
That's why burnout prevention isn't just an HR topic. It's an operations topic. If you want a practical read on how leaders can spot and reduce that pressure before it turns into attrition, Madeira Remote's burnout guide is worth keeping handy.
What to normalize instead
The goal is not to keep everyone equally busy. The goal is to keep the business stable.
A designer at 75% billable utilization may be in a healthier position than a designer at 92% if the first person still has time for review cycles, internal coordination, and the unexpected requests that define agency life. Once you accept that, your staffing conversations get much sharper. You stop rewarding teams for being maxed out and start rewarding them for being reliable, profitable, and still able to think.
A practical framework for optimizing your team
Most firms don't need a grand transformation. They need a cleaner operating rhythm.
The fastest improvement usually comes from replacing manual reconstruction with automatic capture, then turning that raw activity into staffing signals managers can act on. That's why the market moved. In 2026, 54% of organizations adopted dedicated resource management software, overtaking spreadsheets for the first time, and 87% of these managers prioritized operational efficiency over simple cost reduction (Source 1).
That shift makes sense. Spreadsheets can store data. They can't reliably create it.
![]()
Step one gets the raw truth on the table
Connect the systems where work already shows up. For most agencies, that starts with Google Calendar or Outlook, then adds CRM activity and project context.
Manual timesheets produce clean categories but often hide the messy reality of work. Calendar-based capture starts directly from reality. It shows meetings, prep blocks, internal reviews, client calls, and recurring admin load without requiring people to recreate their week from memory.
Step two creates a tagging model people can stick to
Don't overengineer this.
You need enough structure to answer management questions, but not so much that everyone hates the process. A simple tag model often works better than a perfect taxonomy nobody follows.
Use tags that answer four practical questions:
- Who is this for: Client, internal, or prospect.
- What kind of work is it: Delivery, revision, planning, admin, training, or support.
- Is it billable: Yes, no, or conditionally billable.
- Which team owns it: Design, strategy, engineering, consulting, accounts, or operations.
If you want a planning starting point before you move into software, a capacity planning template in Excel can help teams map workload assumptions and spot obvious gaps.
Step three turns history into forecasting
Once your data has basic structure, the next move is to stop looking only backward.
Forecasting is where resource utilization optimization starts paying off operationally. You can see where one team is heading into overload, where another has bench risk, and where a project is staffed with the wrong cost mix before the margin problem lands in finance.
A practical weekly review should answer questions like these:
| Question | What you're checking |
|---|---|
| Who crosses the load threshold soon? | Team members nearing an unsustainable allocation |
| Where do skill gaps appear? | Work assigned to available people instead of the right people |
| Which projects need a staffing change? | Accounts where effort drift no longer matches scope or budget |
| What capacity is still unassigned? | Available time that can absorb pipeline work or internal priorities |
Step four uses decision rules, not manager memory
Many firms stall here. They collect data, then still rely on instinct.
Set a few operating rules and follow them. You don't need many.
- Overload trigger: Review any person scheduled above your internal threshold for two straight weeks.
- Bench trigger: Review meaningful open capacity early, while you still have time to shift work or pull forward pipeline.
- Role mismatch trigger: Escalate when senior staff repeatedly do work that lower-cost roles could handle.
- Margin trigger: Check any project where rising effort shows up without a matching scope or price change.
“If a system depends on managers remembering everything, it isn't a system.”
One factual option in this category is TimeTackle, which connects calendars and CRMs, applies custom tags and rule-based automation, and surfaces utilization and workload patterns through dashboards. That kind of setup works best when the goal is less manual reporting and better day-to-day visibility, not tighter surveillance.
Step five keeps the model honest
No framework survives contact with real delivery unless leaders review it regularly.
Look at the data weekly. Ask where the plan was wrong, not just where people missed the plan. Then fix tag rules, staffing assumptions, and meeting load. Over time, your capacity view gets cleaner, and staffing stops feeling like emergency response.
How optimization works for agencies and consulting firms
The same operating idea plays out differently depending on the business model.
A creative agency usually struggles with fragmented time and hidden effort. A consulting firm usually struggles with role mix, longer staffing horizons, and margin risk from putting expensive people on the wrong work. The mechanics differ, but the point is the same. You need to see what work is happening before you can price it, staff it, or improve it.
A creative agency and the invisible work problem
A mid-sized agency can look well utilized while bleeding time.
That usually happens because the time model only captures obvious client tasks. It misses context switching, internal alignment, review loops, handoff friction, CRM updates, and all the short blocks of coordination that make delivery possible. Verified data shows that hybrid consulting and creative agencies lose 30–40% of their resource utilization to these non-billable, non-tracked activities, often called “invisible work” (Source 6).
Once that work becomes visible, several things change fast:
- Retainers get cleaner: Account leaders can explain where effort really goes.
- Hiring cases get stronger: Ops can show that “we're stretched” is a capacity fact, not a feeling.
- Timesheet fatigue drops: People spend less time reconstructing fragmented days.
The hidden admin load isn't minor. It changes what your team can actually deliver in a week.
A consulting firm and the staffing mix problem
Consulting firms usually have a different issue. They can forecast demand fairly well, but they still hurt margins by assigning the wrong level of seniority.
A six-month engagement might need partner oversight, senior consultant judgment, and junior execution. If that work mix gets blurred, the expensive roles absorb too much of the delivery burden, and the project looks healthy until the cost line catches up. Consequently, utilization data becomes a staffing discipline, not just a reporting exercise.
The useful questions are operational, not abstract:
| Consulting question | Better staffing decision |
|---|---|
| Who has the right skill and real capacity? | Staff based on fit, not visibility |
| Where is senior time doing junior work? | Shift execution work down where possible |
| Which project phases need heavier oversight? | Concentrate expensive time where it changes outcomes |
| What open capacity can cover pipeline risk? | Avoid panic staffing late in the cycle |
In both models, the gain comes from the same move. Make the hidden work visible, then assign people based on true capacity and role value instead of calendar guesswork.
Choosing your tools and measuring the return
Spreadsheets still have a role. They're fine for quick analysis, one-off planning, and sanity checks. They're not enough to run ongoing resource utilization optimization in a growing agency because they depend on manual updates, manager memory, and constant cleanup.
When you evaluate software, keep the checklist tight.
What a tool needs to do
You want a system that removes admin, not one that adds another layer of it.
- Automatic capture: Pull activity from the calendar and connected systems so people don't rebuild their day by hand.
- Flexible categorization: Let teams tag by client, project, work type, and billing status without forcing a rigid setup.
- Useful forecasting: Show future load and staffing conflicts early enough to act.
- Operational reporting: Connect effort to project economics, not just time totals.
One reason this matters financially is simple. Organizations that fail to hit the 70% utilization floor lose about 25% of potential revenue due to underused human capital (Source 2). Underloading and overloading both cost money. Good tools help you see both.
How to measure return without fooling yourself
Don't judge a new system by whether it pushes utilization up.
Judge it by whether it improves decision quality. The return usually shows up in a few places first:
- Cleaner project profitability: You can see which accounts absorb too much senior or non-billable time.
- Fewer overruns: Cost drift shows up earlier, while you still have choices.
- Faster staffing: Managers spend less time chasing availability across disconnected files.
- Lower reporting drag: Teams do less manual admin and more actual delivery.
A useful comparison comes from adjacent service businesses too. In estimating-heavy trades, software creates value by turning scattered inputs into faster, more accurate planning. That's why tools like Exayard plumbing estimating software are worth studying even outside plumbing. The pattern is familiar. Better operational data leads to better margin control.
The main lesson is simple. Buy the tool if it helps you make better staffing, pricing, and workload decisions. Skip it if it only gives you prettier reports.
If your team is still stitching together capacity plans from calendars, timesheets, and spreadsheets, TimeTackle is worth a look. It connects calendar and CRM activity, applies tags and automation, and gives operations leaders a cleaner view of utilization, workload, and reporting without asking everyone to spend more time filling out timesheets.