A new client asks for a fast proposal. The budget is good. The work fits your agency. Someone asks the question that sounds harmless and almost always starts trouble: “Who's free next month?”
Then Slack lights up, project managers start checking half-finished spreadsheets, team leads answer from memory, and somebody opens the calendar to guess. You get an answer, but not a reliable one. You get a pile of partial truths: a designer is “mostly open” except for revisions, a strategist has room if the pitch doesn't land, and engineering can “probably make it work” if two other projects stay on track.
That scramble is expensive because it pushes bad decisions upstream. You either say yes too early and create delivery pain later, or say no because you can't see capacity clearly and leave good revenue on the table. Most agencies think they have a staffing problem when they really have a forecasting problem.
Why “who's free” is the most expensive question in your agency
The cost of bad visibility rarely shows up as one dramatic failure. It shows up as a pattern.
A sales lead closes work based on rough confidence. Operations tries to fit it in. Team leads protect their people by padding estimates because they don't trust the pipeline. Clients get ambitious dates because nobody wants to slow momentum. Then the actual work arrives and exposes every guess.
The fire drill that keeps repeating
I've seen the same version of this play out in creative, marketing, and implementation shops. A client wants a launch moved up. Another project slips because approvals drag. A specialist becomes the bottleneck because only that person can do the work. By the time leadership notices, the schedule is already broken.
The damage isn't just stress.
- Missed revenue. You turn down work you could have delivered if you'd seen demand sooner.
- Thin margins. Teams absorb overruns because the original plan was built on hope.
- Quality drift. Rushed projects get more revisions, more rework, and more client friction.
- Talent strain. The same dependable people keep carrying impossible weeks.
You can't run an agency on “probably.” You need a forecast that tells you what demand is forming before it lands on someone's desk.
This is why workload forecasting matters. Not as an academic exercise. Not as another admin layer. As a practical way to stop making staffing decisions at the last minute.
The data is usually already there
Most agencies don't need a data science team to start. They need to stop ignoring the signals they already create every day.
Your calendars show where time goes. Your CRM shows likely future work. Your project tool shows committed scope. Your invoicing and delivery records show what similar work took in the past. None of those systems are perfect on their own, but together they give you a working picture of demand.
That's the key shift. You stop asking “who's free?” as if availability is a feeling, and start asking better questions:
- What work is already committed?
- What work is likely to close?
- Which roles will hit a bottleneck first?
- Where are we underbooked, and where are we about to overload people?
When agencies make that shift, the whole operating rhythm changes. Sales stops promising in the dark. Delivery stops reacting to avoidable surprises. Leadership gets a calmer, more honest view of what the business can take on.
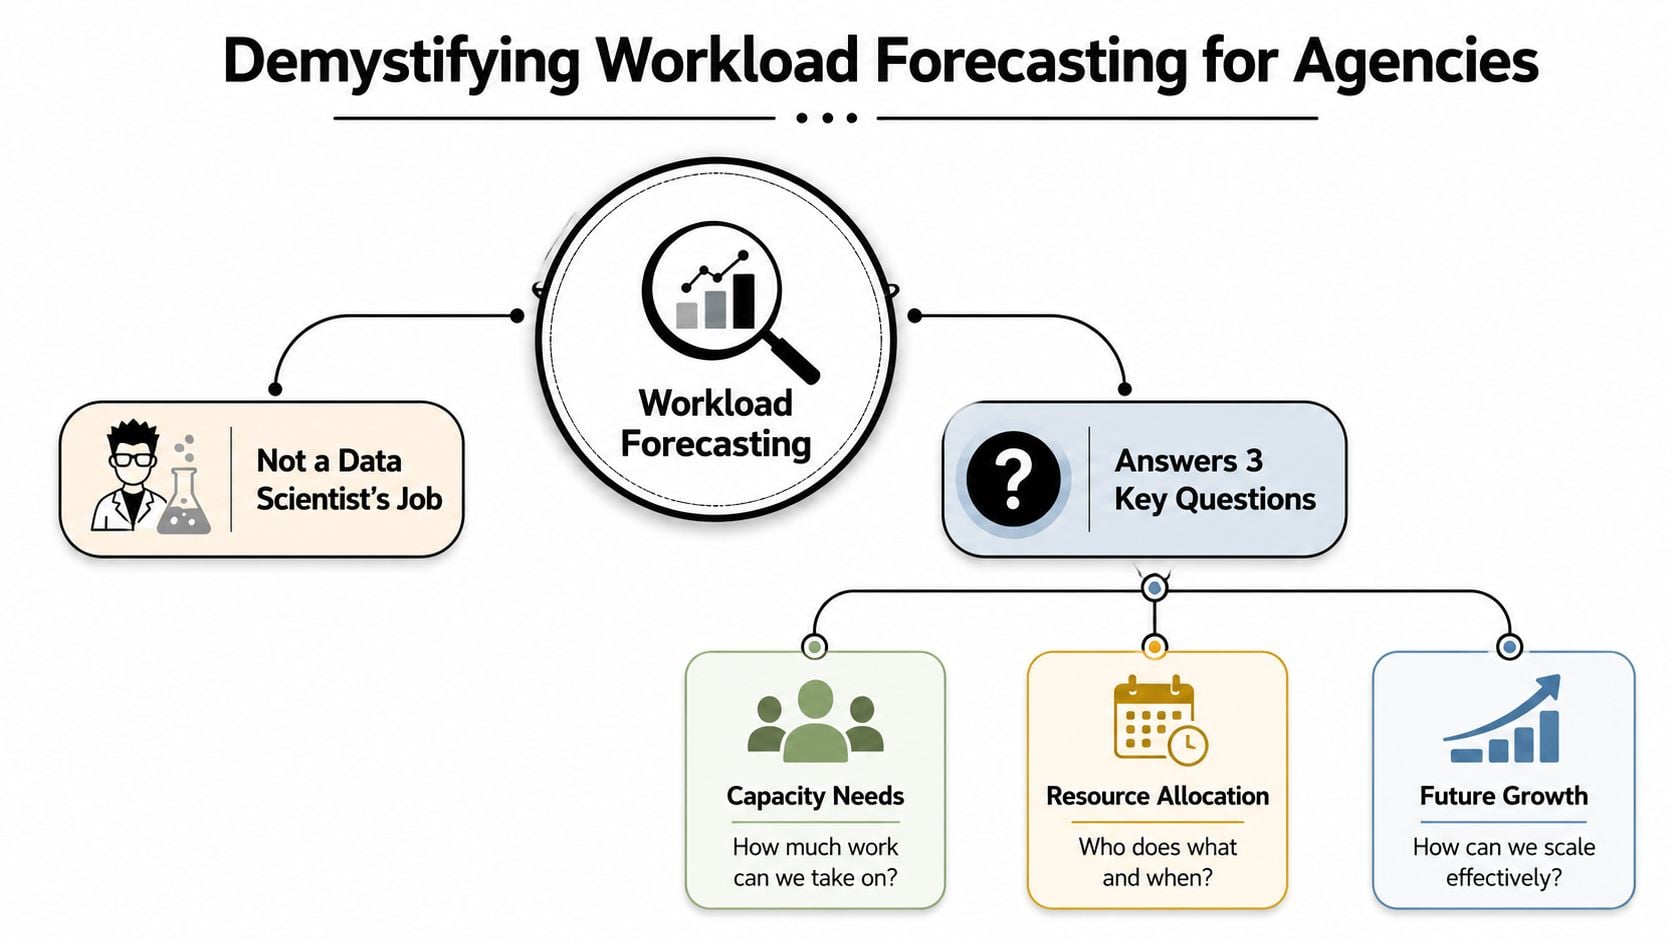
What workload forecasting actually means for an agency
Workload forecasting sounds technical, but the agency version is simple. It means estimating future demand for work, then comparing that demand to the team capacity you have.
At a basic level, you're trying to answer three questions:
- What work is already sold and scheduled?
- What work is likely to arrive soon?
- Do we have the right people, with the right skills, at the right time?
Think like a restaurant, not a spreadsheet
A restaurant doesn't plan the week by asking whether tables are empty right now. It looks at reservations, expected walk-ins, peak times, staff coverage, and kitchen constraints. A fully open dining room on Tuesday afternoon tells you almost nothing about Friday night.
Agencies work the same way. A person who looks free this week may be the wrong skill set, may already be committed to likely pipeline work, or may be carrying hidden work that never made it into the resource sheet. So the point isn't to find empty hours. The point is to predict demand early enough to make useful decisions.
That's what formal forecasting has always aimed to do. Workload forecasting has deep roots in operations research, and NIST's guide on workload forecasting describes a structured process built on historical data, forecasting objectives, data collection by workload level, and methods like moving averages, linear regression, and Box-Jenkins. In call centers, planners were already using it at every half hour to estimate arrivals and service times, which shows how closely forecasting ties to real staffing decisions.
Capacity, workload, and utilization are not the same thing
Agency teams mix these terms all the time, and that's where planning gets muddy.
| Term | What it means in an agency | What it helps you decide |
|---|---|---|
| Capacity | The hours your team can realistically work in a period | Hiring, staffing, leave planning |
| Workload | The demand for those hours from sold work and likely incoming work | Scheduling, scoping, intake control |
| Utilization | How much available time goes to productive or billable work | Margin control, team efficiency, role mix |
If you want a clean primer on the first of those, this guide on capacity planning for teams is useful because it separates available effort from forecasted demand.
Practical rule: Capacity is supply. Workload is demand. Utilization tells you how well supply matched demand after the fact.
What this looks like in daily operations
For an agency, a good forecast usually includes:
- Committed work from signed projects, retainers, and recurring delivery.
- Weighted pipeline work based on deal stage, timing, and likely scope.
- Role-based demand so design, strategy, development, media, and account management are forecast separately.
- Known constraints like holidays, training time, internal meetings, and leadership overhead.
Once you have that, workload forecasting stops being abstract. It becomes the system that tells you whether to accept a project start date, push a launch, bring in a contractor, or protect margin before the team gets buried.
The two main methods for predicting your workload
Most agencies use two forecasting methods, whether they admit it or not. One is instinct dressed up as experience. The other is history turned into a model. You need both.
The mistake is choosing one and pretending it's enough.
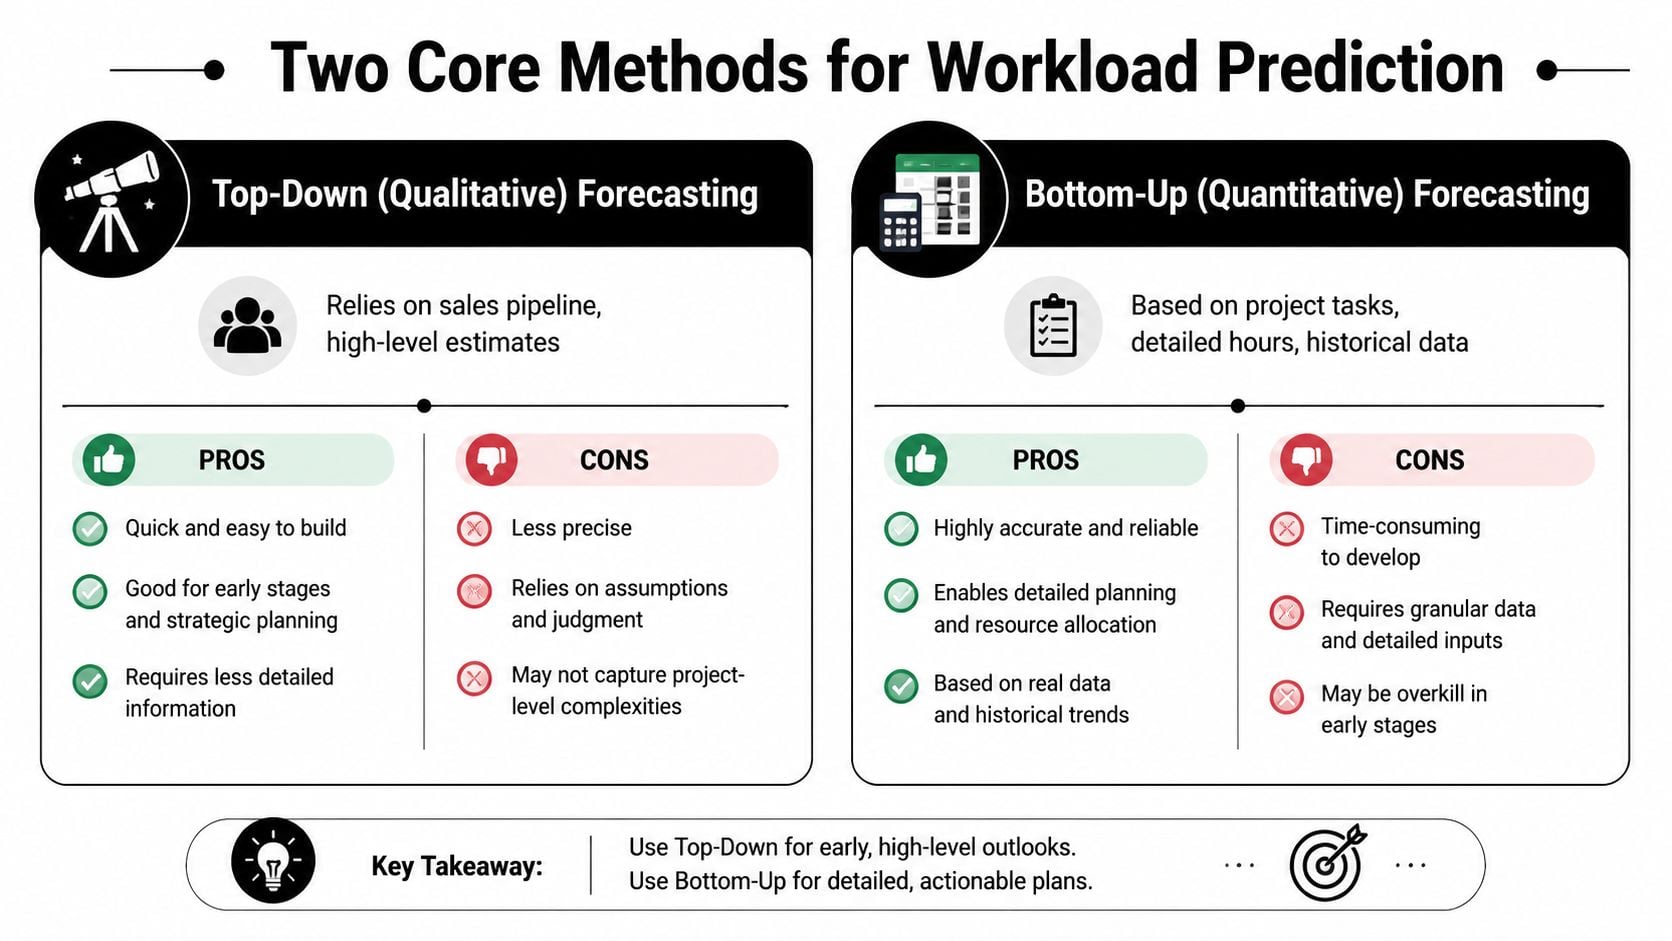
Top-down forecasting
Top-down forecasting starts with the business view. Sales looks at the pipeline. Client services knows which accounts may expand. Leadership knows where renewals are shaky and where bigger scopes are likely. You estimate incoming work from the top and translate that into rough resource demand.
This method is fast, which is why agencies use it all the time. It's useful when:
- Deals are early and the scope is still fuzzy
- Leadership needs quick scenarios for hiring or planning
- Pipeline timing matters more than task detail
But top-down forecasting has an obvious weakness. It's only as good as the assumptions behind it. Sales optimism, vague scopes, and shifting client decisions can all distort the picture.
Bottom-up forecasting
Bottom-up forecasting works from the delivery layer upward. You take actual project history, break work down by service type, task type, client pattern, or role, and use that to estimate future demand.
In this context, data quality matters most. The basic premise of workload forecasting is using past observations to estimate future demand, and Accelo's overview of workload forecasting notes that forecast quality depends directly on the quality and granularity of that historical data. For agencies, that means total hours aren't enough. You need hours broken down by client, project, and task type if you want a model you can trust.
Here's the side-by-side view:
| Method | Main input | Best use | Strength | Weakness |
|---|---|---|---|---|
| Top-down | Pipeline, account knowledge, leadership judgment | Early planning | Fast and flexible | Can drift into wishful thinking |
| Bottom-up | Historical hours, tasks, project patterns | Staffing and delivery planning | More grounded in actual work | Needs clean data |
The best forecast uses both
A forecast built only from pipeline discussions will usually overstate certainty. A forecast built only from historical averages will miss context. Clients change behavior. Services evolve. One-off projects distort baselines.
So the practical answer is to combine the methods.
Start top-down to estimate what may arrive. Then pressure-test it with bottom-up data from similar work. If sales expects a large website rebuild, compare that assumption to what your last few rebuilds consumed across strategy, design, development, QA, and project management. If the numbers don't fit, that tension is useful. It forces a better conversation before you sell the wrong promise.
Good forecasting doesn't remove judgment. It gives judgment something solid to push against.
This isn't unique to agencies either. In other sectors, teams use the same split between market signals and historical patterns. If you want a cross-industry example, this piece on demand forecasting AI for retail shows how businesses combine forward-looking demand signals with historical behavior to improve planning.
Don't build your model on weak time data
This is the part many firms skip because it's annoying. If your time data is sparse, late, or entered from memory on Friday afternoon, your bottom-up forecast will be shaky. It may still be better than guessing, but it won't stay trusted for long.
You don't need sophistication first. You need consistency first.
Collect time in a way people will stick to. Use categories that reflect how the business runs. Keep service lines stable enough to compare over time. Forecasting gets much easier once your history stops changing shape every month.
A step-by-step plan to implement workload forecasting
Monday morning, sales asks if the agency can take on a new website project. Delivery says maybe. Finance wants the margin. Nobody can answer with confidence because capacity lives in three places and half of it is based on memory. That is usually when agencies realize forecasting is not a modeling problem first. It is an operating system problem.
The good news is you do not need a data team to fix it. Agencies can start with the data they already have, especially calendar activity, project schedules, and past delivery hours. The goal is simple. Build a planning habit that is accurate enough to protect profit, realistic enough to keep teams sane, and light enough that people will keep it updated.
Step 1. Centralize the time data you already have
Start with one source of truth for where time went. If delivery uses one spreadsheet, finance uses another, and resource planning sits in someone's head, the forecast will drift before the week is over.
For many agencies, calendar data is the fastest place to start because it already exists. Client calls, internal reviews, workshops, working sessions, standups, sales meetings, and planning blocks all leave a trail. It is not perfect, and it will miss some focused execution time, but it gives you a usable baseline without waiting for perfect timesheet behavior.
![]()
Set a few tagging rules early so the data stays useful:
- Tag by client so revenue work is separate from internal work.
- Tag by service line so strategy, creative, media, development, and account management can be forecast separately.
- Tag by work type so recurring tasks can be compared across projects.
- Tag non-billable time so leadership, training, hiring, and admin are visible instead of consuming capacity unnoticed.
If you need a practical starting point, this capacity planning template in Excel helps organize people, available hours, and expected demand in one place.
Step 2. Standardize your work types
Forecasting gets easier once the agency agrees on what work is.
Custom projects still follow patterns. A website redesign may differ in scope and client politics, but it still tends to include discovery, planning, design rounds, development, QA, launch support, and project management. A paid media retainer still includes setup, reporting, optimization, creative requests, and client communication.
Document those patterns and define standard work types with expected effort ranges from past projects. Keep the list short enough that teams will use it, but clear enough that estimates mean the same thing from one project to the next. If every PM names the same work differently, historical data becomes hard to compare and impossible to trust.
Step 3. Build a simple forecast model
Start with a spreadsheet. That is enough for most agencies at this stage.
List each person by role. Add their available capacity for the next planning period. Subtract committed work. Add likely pipeline work with a confidence rating. Then review the picture by role, not just as a total number of hours.
That last part matters more than agency leaders expect. An agency does not sell generic hours. It sells specialist capacity. A healthy total can still hide a design bottleneck, an overbooked PM team, or underused strategists.
Forecast demand by role. A spare account manager does not solve a designer bottleneck.
Your first model should show:
- committed hours by role
- probable incoming hours by role
- available capacity by role
- overload and underload flags
- decisions that need action this week
Keep it simple enough to update in 15 minutes. If the model takes half a day to maintain, people will stop trusting it, then stop using it.
Step 4. Review it on a fixed rhythm
A forecast is only useful if it changes when reality changes. In agency work, reality changes every week.
Review workload on a weekly or biweekly cadence with the people who can change the plan. That usually means sales, client services, project management, and delivery leads. The meeting should stay short and operational. Confirm what closed, what slipped, what expanded, which projects are consuming more than expected, and where role pressure is building.
I run these reviews around decisions, not status updates:
- Which new work can we start without hurting current delivery?
- Where do timelines need to move before the team gets squeezed?
- Which roles need freelance support, hiring, or scope control?
- Which assumptions were off last cycle, and why?
The process starts to pay for itself. Sales stops selling into invisible gaps. Delivery gets earlier warning. Finance gets a clearer view of margin risk. The forecast improves because the business gets better at telling the truth before the damage shows up in missed deadlines or burned-out teams.
Key metrics to know if your forecast is working
A forecast isn't good because it looks neat. It's good if it helps you make better calls and improves over time.
That means you need a small set of operating metrics that expose whether your assumptions matched delivery.
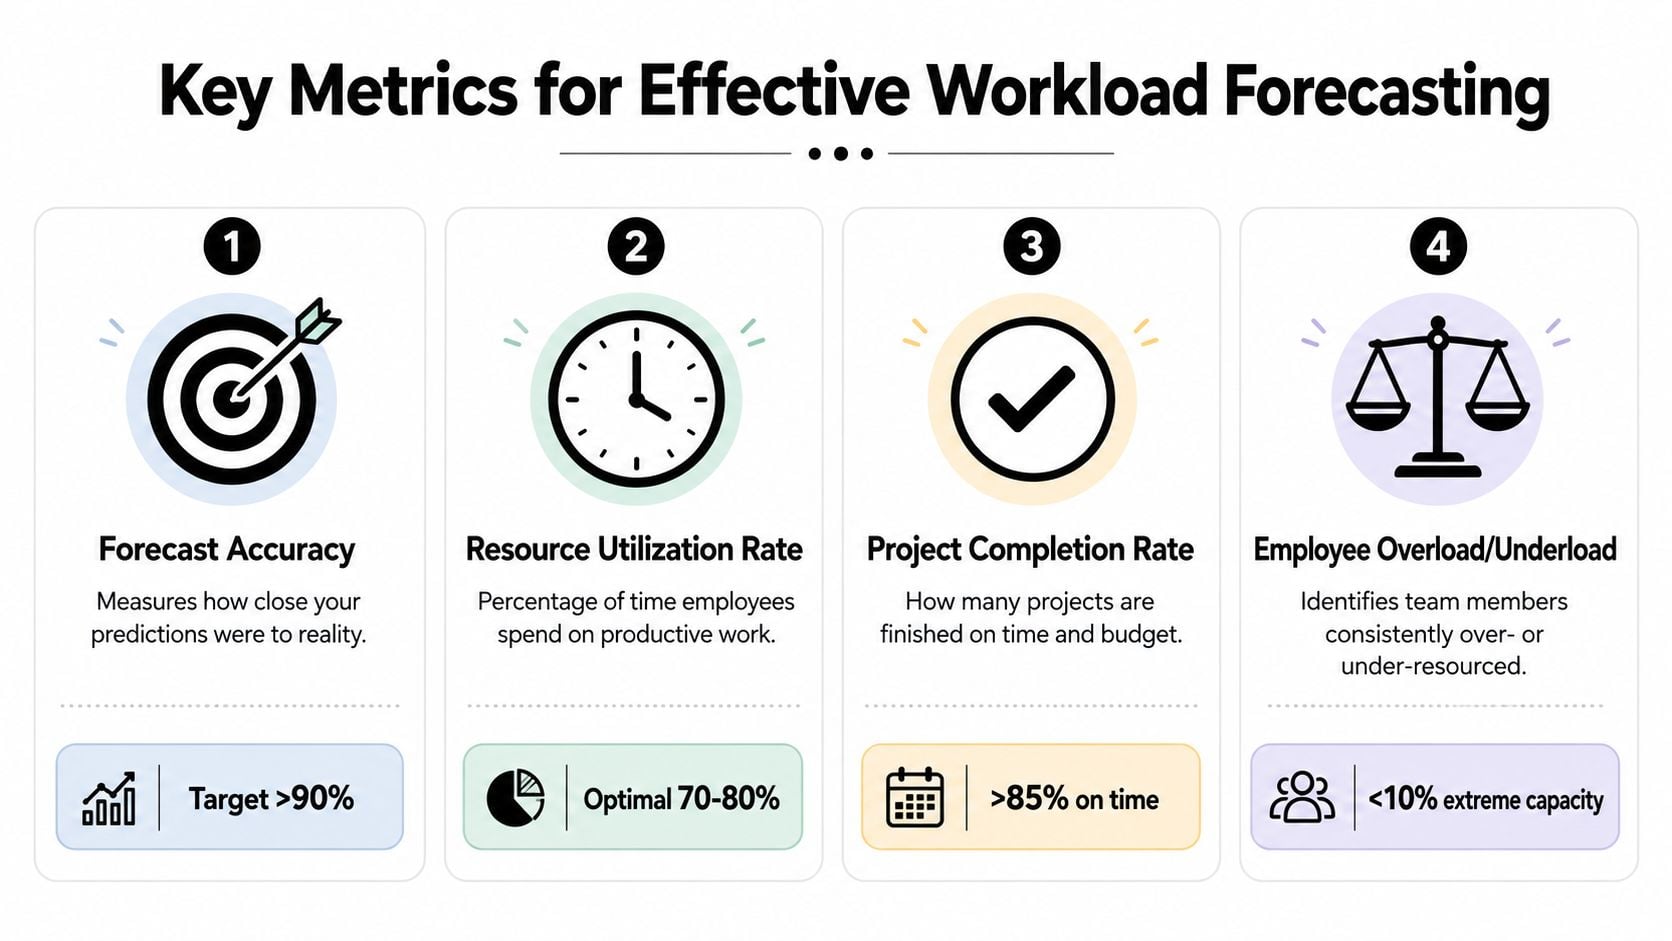
Forecast accuracy
This is the first metric to track because it tells you whether your planning model has any grip on reality.
For an agency, the simplest version is the percentage difference between forecasted hours and actual hours for a project, service line, or role over a set period. In advanced forecasting, models are often judged by RMSE, and a GRU-based deep learning model achieved the lowest RMSE versus simpler models in a cloud workload study that used an 80/20 split, with 20% of the training set reserved for validation, according to the University of Melbourne cloud forecasting paper. You don't need that level of modeling to start. You do need to compare forecasted hours to actual hours every cycle.
A practical formula:
| Metric | Simple formula | What it tells you |
|---|---|---|
| Forecast accuracy | (Forecasted hours - Actual hours) / Actual hours | Whether your planning assumptions are drifting |
Use it at the project level first. Then roll it up by service type. You'll usually find that some work is easy to predict and some work is habitually under-scoped.
Billable efficiency
Utilization gets all the attention, but billable efficiency gives leadership a more useful view of whether paid capacity is turning into revenue work.
A simple version is billable hours divided by total paid hours over the same period. If that number drops, one of two things is usually happening. Either demand fell and you have underused capacity, or the team is drowning in internal work, admin, meetings, and rework.
For teams that want a cleaner definition and formula, this guide on how to calculate utilization rate is a solid reference.
Track billable efficiency by team and role, not only agency-wide. Agency-wide averages hide a lot.
- Creative teams may be overloaded by revision churn.
- Strategy teams may be spending too much time in pre-sales.
- Project management may be carrying coordination load from poor scoping.
- Leadership roles may be absorbing delivery rescue work that doesn't show up clearly elsewhere.
Schedule variance
Forecasting isn't only about hours. It's about timing. A project can hit roughly the expected effort and still wreck the plan if it finishes late and blocks downstream work.
Schedule variance is the difference between planned completion timing and actual completion timing. Agencies often treat delays as project-level issues, but recurring delays usually expose forecasting flaws. Maybe discovery always takes longer than assumed. Maybe legal review or stakeholder approval keeps shifting starts. Maybe one specialist role is overloaded every month.
If projects keep finishing late, don't just blame delivery. Check whether you forecasted the right effort at the right time.
Overload and underload by role
This is the metric I trust most in practice because it drives actual staffing choices. Look at upcoming demand against available capacity by role. If one team repeatedly shows overload while another shows slack, you're not looking at a utilization problem. You're looking at a mix problem.
The best use of this metric is simple. It tells you when to hire, train, rebalance work, use freelancers, or say no to a project start date before the margin disappears.
Common pitfalls and how to avoid them
Monday starts with a familiar question: who's free next week? In a lot of agencies, that question kicks off a scramble through calendars, half-filled timesheets, and project plans that were accurate two Fridays ago. The problem is not forecasting theory. The problem is trying to run a live agency with data that was never set up for real operating decisions.
The mistakes that break workload forecasting are usually operational. They show up in how work is scoped, how time is captured, and who is expected to keep the forecast current.
Forecasting at the wrong level of detail
Agencies usually miss in one of two directions. They forecast at the top line and miss the actual constraint, or they forecast at the task level and create a maintenance job nobody can sustain.
Forecast at the level where you make staffing decisions. For most agencies, that means by role, service line, and a short planning horizon.
That matters because hours are not interchangeable. Forty available hours in paid media does not solve a shortage in design. A healthy total can still hide a bad mix. I have seen agencies approve new work because total utilization looked fine, then lose margin because one specialist group carried all the strain.
If the forecast will trigger a hire, shift delivery dates, or change who gets assigned, it is detailed enough. If it cannot support those calls, it is too broad. If it takes so long to maintain that people stop updating it, it is too detailed.
Forgetting non-billable time
This is one of the fastest ways to create a forecast that looks disciplined and fails in practice.
Client delivery is only part of the week. Pre-sales, internal reviews, hiring interviews, training, team management, finance admin, and process work all use real capacity. Creative and service agencies feel this harder than the spreadsheet suggests because senior people often absorb this work without logging it cleanly.
Build those categories into baseline capacity from the start. Do not leave them as a balancing item. If account leads spend every Thursday in internal reviews, reduce capacity for that role accordingly. If your strategy team is heavily involved in pitches, reflect that before you promise delivery dates.
Treating the forecast like a monthly artifact
A forecast that gets refreshed once a month is usually too old to trust.
Deals move. Start dates slip. Scope expands. People take leave. One client delay can free up a team for a week, and another can stack three projects into the same window. Agency demand changes in small ways every few days, not in one neat batch at month end.
Set a review rhythm that matches that reality. Weekly is usually enough. Daily is overkill for most firms unless resourcing is extremely tight. One owner should be accountable for keeping the forecast current, even if project leads, sales, and department heads all feed inputs into it.
I would rather run a plain forecast with clean weekly updates than a complex model nobody touches.
Relying on bad timesheet data
Poor input wrecks confidence fast.
If people enter time late, round everything to the nearest half day, or use inconsistent labels, historical patterns become hard to use. Then team leads start overriding the numbers by instinct, and the forecast becomes a political exercise instead of an operating tool.
The fix is not more policing. The fix is lower-friction data capture and tighter categories. Use systems your team already lives in, especially calendar data, project tools, and delivery workflows. Standardize naming. Keep category rules simple enough that people can apply them without asking for help. Check the data every week, correct obvious tagging issues early, and avoid letting cleanup pile up for a quarter.
That is the practical bridge between textbook forecasting and agency reality. You do not need a data science project to get started. You need cleaner operating data, a short planning window, and enough discipline to review the forecast before small misses turn into margin problems.
Forecasting works when the input matches how the team actually works.
When agencies avoid these traps, forecasting stops feeling like extra admin. It becomes a reliable way to protect margin, set realistic start dates, and keep good people out of constant rescue mode.
If your agency is tired of chasing late timesheets and trying to forecast from messy spreadsheets, TimeTackle is worth a look. It pulls work data from calendars and connected systems, helps teams categorize time with less manual effort, and gives operations leaders a cleaner view of capacity, utilization, and upcoming demand without turning time tracking into a weekly fight.