You can feel this problem before you can prove it.
The agency is busy. Revenue looks healthy. The pipeline isn't empty. Account managers say the big clients are “good accounts.” Yet month-end still feels off. One team is slammed, another is underused, write-offs keep showing up, and nobody can answer a basic question without opening five spreadsheets: which clients make money?
That's where most agencies get stuck. They have billing data, project plans, payroll, maybe decent time tracking, but they don't have a clean way to connect those pieces at the client level. So they manage by instinct. Instinct can help with creative work. It's a bad way to run margins.
Why most agencies are flying blind on client profitability
A lot of agencies confuse high revenue with good business. That mistake gets expensive fast.
I've seen this pattern over and over. A client bills well every month, renews on time, and gets plenty of internal attention, so everyone assumes the account is strong. Then you trace the work behind it. Senior people jump into calls that weren't scoped. Strategy gets redone three times. The PM spends extra hours calming things down. Sales promised a little too much in the pitch. Suddenly the “great” account is eating more capacity than it pays for.
That's why client profitability analysis matters. It answers a harder question than “What did this client pay us?” It asks, “After we win the work and deliver the work, what's left?”
Customer economics have shifted from pure acquisition thinking toward retention and margin management, which is one reason client-level profitability has become more operationally important in service businesses. A widely cited benchmark from Bain & Company says that increasing customer retention by just 5% can raise profits by 25% to 95%, as noted by Saras Analytics in its write-up on customer profitability analysis. The catch is obvious. Retaining the wrong clients doesn't help much.
Practical rule: Retention is only good news when the client is profitable, or when you have a clear reason to keep investing despite current margin.
Most agencies don't miss this because they're careless. They miss it because the cost side is messy. Revenue is easy to see. Delivery effort is scattered across calendars, timesheets, Slack follow-ups, revision loops, support calls, and leadership attention. If your books also need cleanup before any real analysis starts, a resource like cleanup bookkeeping services can help get the financial base into shape before you try to judge account performance.
What flying blind looks like
Here are the warning signs I'd watch for:
- Big clients trigger stress: The team dreads the account, even though the invoices look good.
- Margins surprise finance: Profit drops at month-end, but nobody spotted the leak during delivery.
- PMs can't explain overages: They know a project ran hot, but they can't tie that to client-level economics.
- Leadership debates anecdotes: Decisions about renewals, pricing, and staffing come down to whoever argues best.
Client profitability analysis fixes that. Not because it gives you one magic number, but because it forces you to connect revenue to the full cost of serving the client.
The core metrics you actually need to track
This is often made harder than it needs to be. You don't need a giant finance model on day one. You need a short list of numbers that tell the truth.
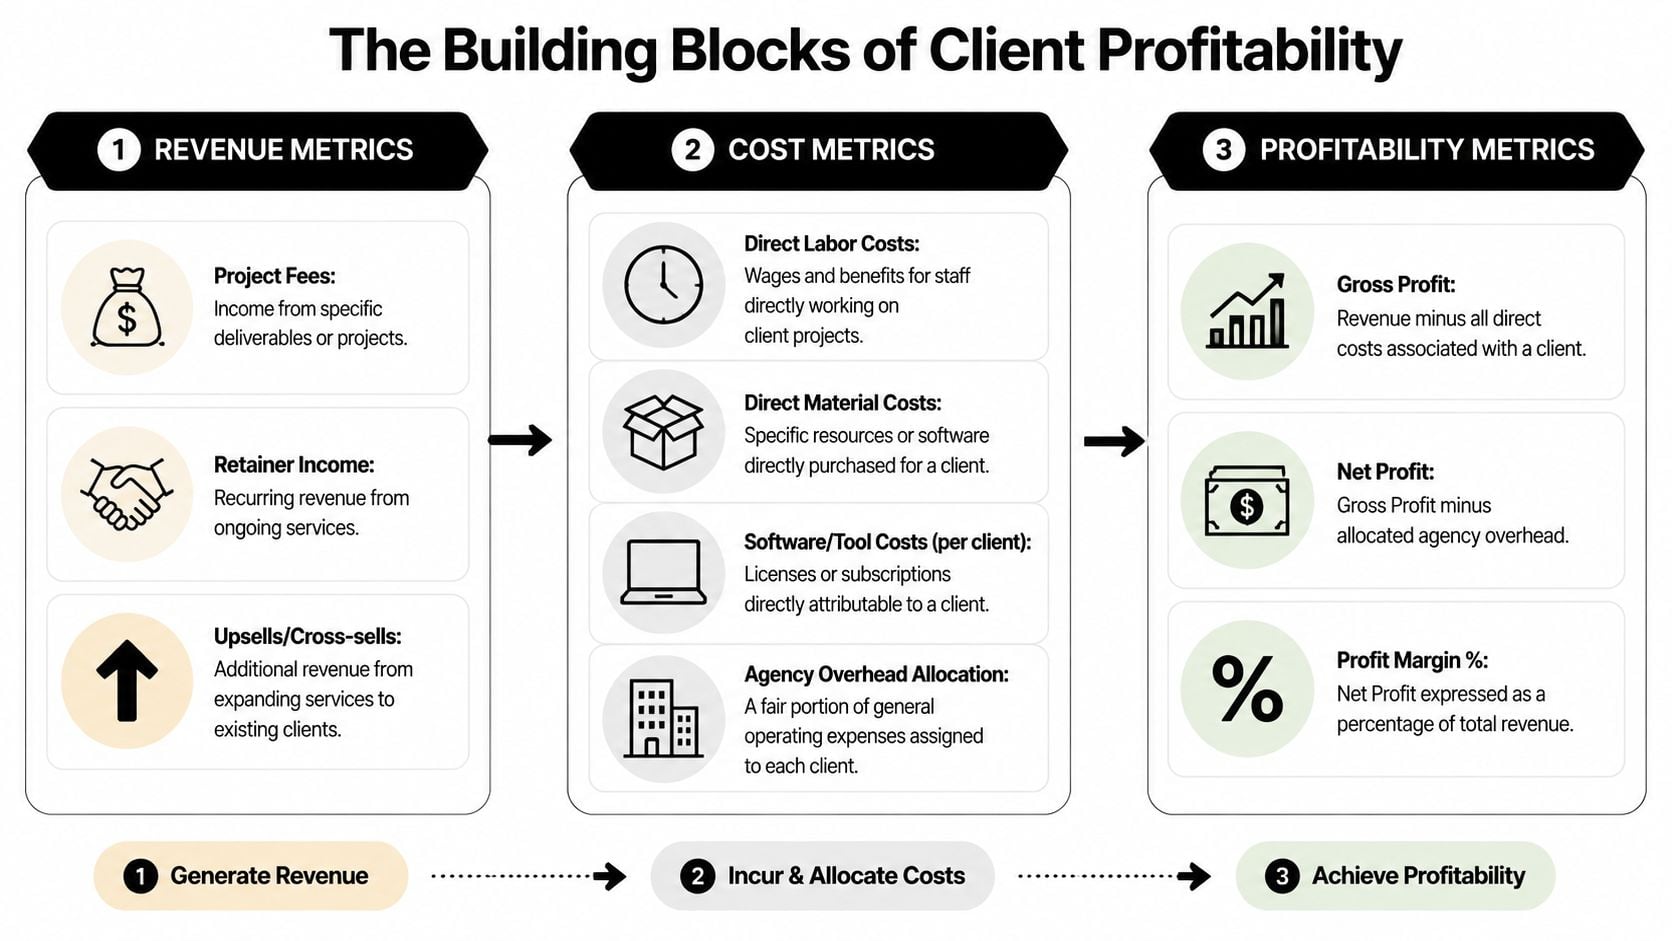
Start with revenue metrics
Revenue sounds simple until agencies muddy it with booked value, contracted value, and expected renewals. For client profitability analysis, stay strict.
Track:
- Project fees: What the client paid for specific work.
- Retainer income: Recurring fees tied to ongoing services.
- Upsells and cross-sells: Extra work sold into the same account.
Don't mix signed pipeline into this view. Use recognized client revenue, not wishful thinking.
Then get serious about costs
This is where weak reporting falls apart. You need to separate direct costs from indirect costs.
| Metric | What it means in practice | Why it matters |
|---|---|---|
| Direct labor cost | Team time spent doing client work | Usually the biggest cost in agencies |
| Direct tool or vendor cost | Paid media support tools, freelancers, software bought for one client | Easy to miss if procurement is messy |
| Indirect service cost | Account management, onboarding, internal reviews, support time | Often where margin disappears |
| Overhead allocation | Leadership, operations, general software, office costs | Needed for a truer net view |
A lot of PMs only track billable hours and invoice value. That gives you a partial answer. Better than nothing, but still partial.
If you want a plain-English refresher on how net margin works once costs are assigned, Stewart Accounting's net profit guide is a useful reference.
The two operating metrics PMs should know cold
You don't need to become an accountant, but you do need to understand these:
- Realized rate: What you earn for the hours spent, not what your rate card says.
- Utilization: How much of your team's available time goes to billable or value-producing work.
If your team struggles to calculate utilization cleanly, this guide on how to calculate utilization rate is worth bookmarking.
The cleanest client reports come from teams that agree on definitions first. Most reporting fights are really definition fights.
The profitability numbers that matter
I'd keep it to two levels:
- Gross profit: Client revenue minus direct costs.
- Net profit: Gross profit minus allocated overhead and shared service costs.
And then one ratio:
- Profit margin percentage: Net profit expressed as a share of client revenue.
That's enough to make real decisions. Once those numbers are stable, you can add more nuance. Until then, more metrics usually mean more confusion.
A step-by-step method for calculating client profitability
This is the part people skip. They jump from “we should measure account margin” straight into a dashboard, then wonder why nobody trusts the output. The method matters more than the chart.
Step 1 and step 2
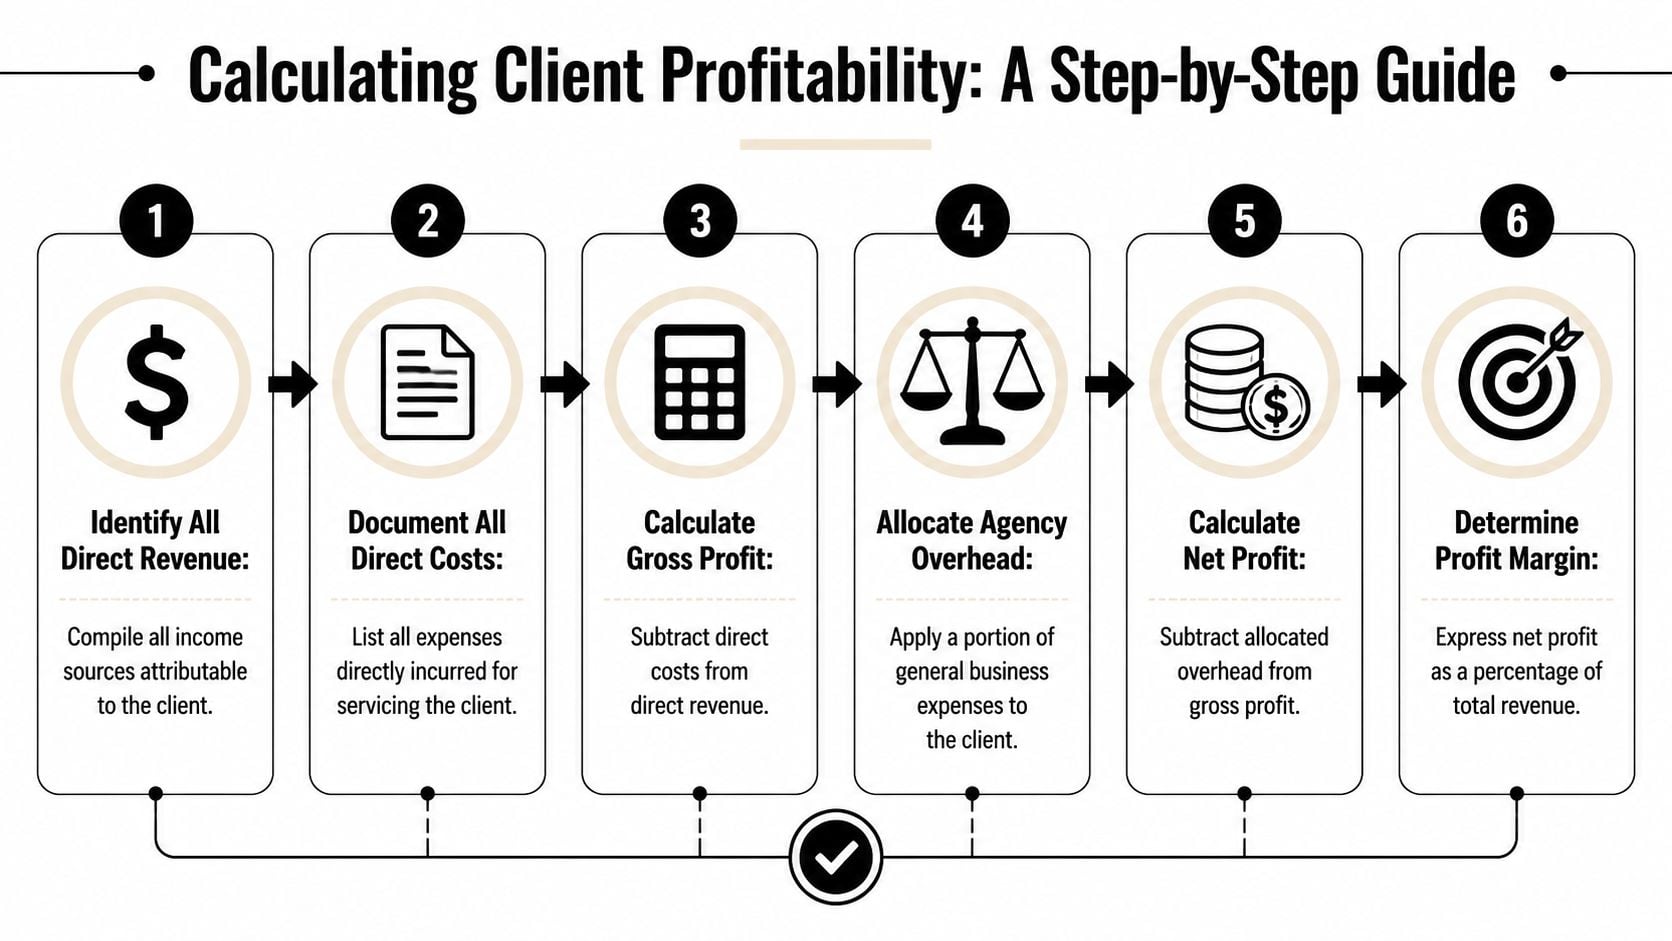
Pull together all revenue tied to the client, then list all direct costs tied to delivering that work.
That includes invoices, retainers, and approved extra work on the revenue side. On the cost side, capture delivery labor, contractor spend, direct software, and any vendor expenses bought for that account.
If your team still reconstructs delivery effort from memory, fix that first. A practical starting point is better billable-hour discipline, and this guide on mastering calculating billable hours can help clean up that process.
Step 3 and step 4
Now calculate gross profit.
Gross profit = Client revenue – Direct costs
This number tells you whether the work itself is economically sound before shared business costs enter the picture. It's useful, but it's not enough for agency decisions.
The next step is where more mature analysis begins. A stronger model maps client touchpoints, assigns costs to those touchpoints, and then segments clients accordingly. That matters because clients with similar revenue can have very different margins once support, onboarding, and account management are assigned. As Teradata explains in its overview of customer profitability analysis, the highest-value clients are not always the largest-revenue clients.
Step 5 and step 6
Allocate shared costs, then calculate net profit.
Net profit = Gross profit – Allocated overhead
Agencies must exercise discipline. You don't need a perfect allocation model. You do need a consistent one.
Use a simple rule set like this:
- Map recurring touchpoints: onboarding, weekly reporting, account reviews, support, leadership oversight.
- Assign effort owners: who does the work, how often, and whether it scales with client complexity.
- Apply a cost basis: hours, loaded labor cost, or another consistent method.
- Roll that into the client view: so margin reflects the actual service model.
If two clients pay the same fee but one needs constant senior attention, they are not the same client financially.
A simple worksheet logic
Here's the version I'd give a new PM:
| Line item | Include it | Notes |
|---|---|---|
| Invoices and retainers | Yes | Use actual client revenue |
| Delivery team labor | Yes | Include all time, not just billed time |
| Freelancers and vendors | Yes | Direct project costs |
| Software bought for one client | Yes | Direct attribution is easy |
| Account management time | Yes | Often omitted, but should not be |
| Onboarding and setup effort | Yes | Spread if needed, but count it |
| General agency overhead | Yes | Allocate consistently |
| Unapproved pipeline value | No | Not earned revenue |
| Gut feel about client value | No | Keep separate from the math |
The point isn't accounting purity. The point is decision quality. A decent, trusted model beats a “perfect” one nobody updates.
The hidden costs that sink your margins
Most bad client margin reports don't fail on revenue. They fail on shared effort.
A client may look fine when you subtract only direct delivery hours from billed fees. Then you add the rest of the work that happened around the edges and the margin changes fast. Management reviews. Pre-sales handoff time. Kickoff prep. Internal QA. Fixing mistakes. Rework after vague feedback. None of this is unusual. All of it costs money.
Parakeeto makes this point directly in its article on customer profitability analysis. Profitability can change materially depending on whether you allocate management time, pre-sales effort, project setup, and rework at the client level, and agencies often make retention or pricing decisions from the wrong margin signal when those shared labor costs are ignored, as noted in this Parakeeto guide.
Four margin leaks I'd check first
- Pre-sales drag: Some clients take a lot of senior time to win, and that effort never gets recovered if the account starts underpriced.
- Scope creep: Not dramatic scope changes. Small extras, repeated often, that gradually absorb capacity.
- Revision loops: Work gets approved slowly, reopened often, or changed after internal client politics surface.
- Management overhead: Senior people jump in because the account is sensitive, messy, or politically important.
This is why “revenue minus direct labor” is only a starting point.
Why project-level analysis matters too
A client account can look healthy in aggregate while one project inside it is imperceptibly destroying margin. That's common in agencies with mixed work types. A retainer may be stable, while one rushed launch or badly scoped implementation wipes out months of good economics.
You need to look at both levels:
- Total-client view: Is the account worth keeping overall?
- Per-project view: Which engagement types are making or losing money?
That second view tells you what to fix. Maybe the client is fine, but one service line is priced wrong. Maybe strategy work is strong, but production work always overruns. Maybe the problem is not the client at all. It's your scoping process.
If your team needs a better handle on cost discipline more broadly, this guide for small business expense control gives a solid operational frame.
The hidden cost is usually not hidden. The agency just never assigned it to the client that caused it.
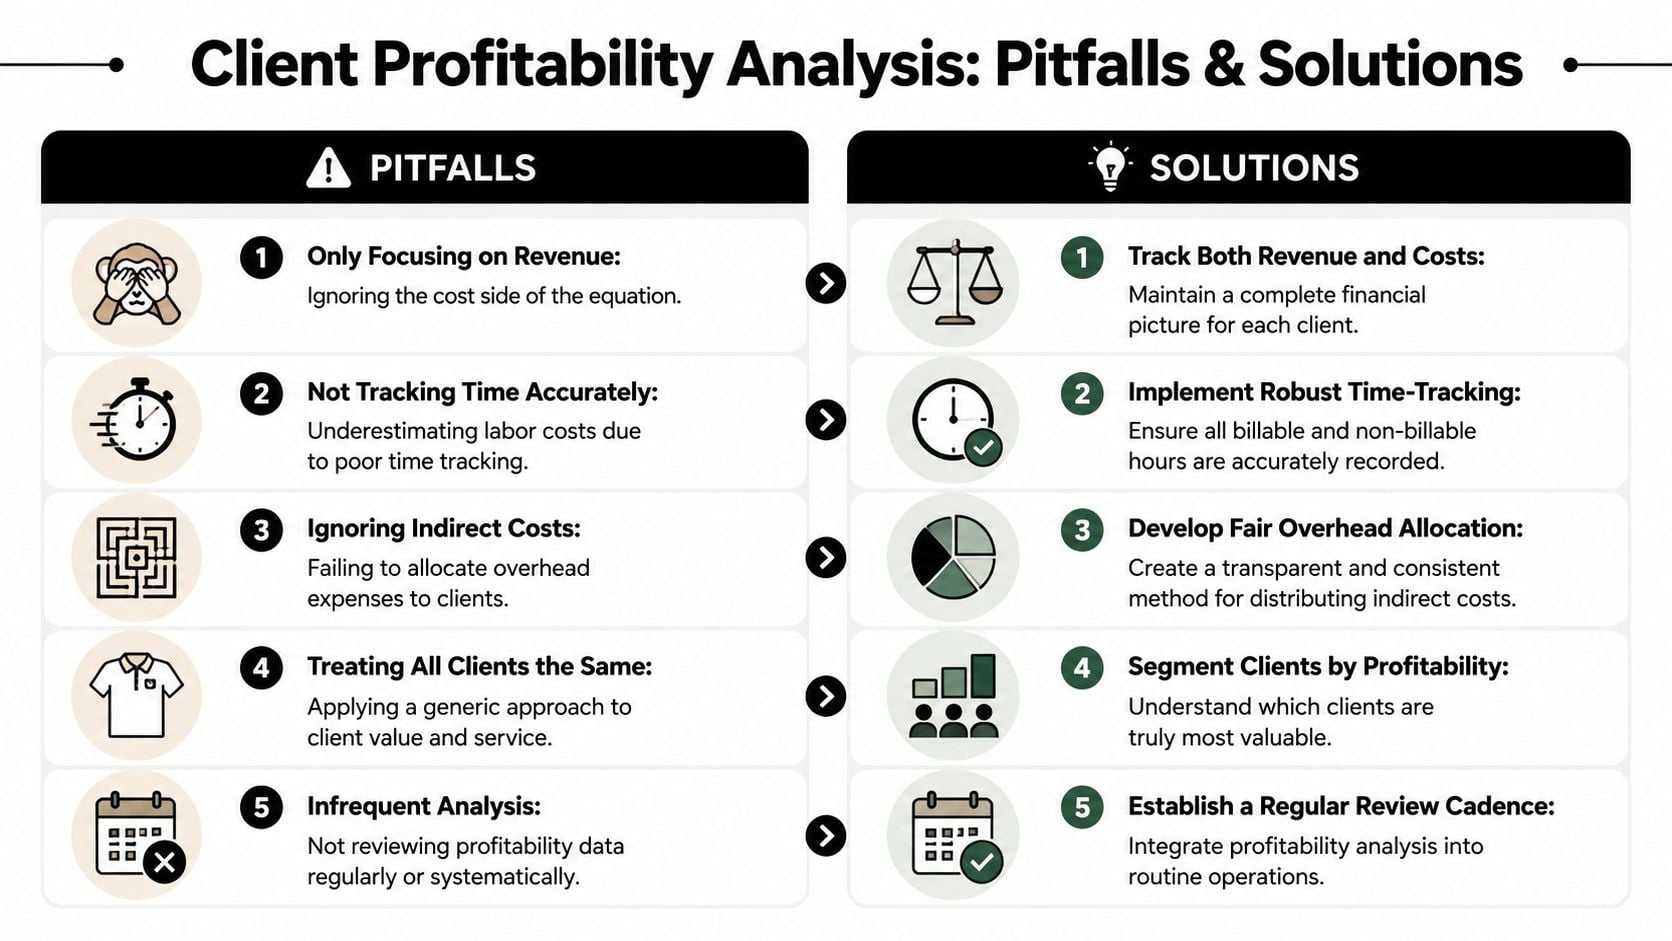
Common pitfalls and what to do instead
The biggest mistake agencies make after running client profitability analysis is overreacting to the first report.
They find a few accounts in the red and jump straight to “fire the client.” That can be the right move, but it's often lazy thinking. A low-profit client is not always a bad client. CostPerform's view is more useful: profitability should be read alongside retention, growth potential, and strategic fit, and a client with modest current margin may still be worth keeping if it improves team utilization or opens a larger account, as explained in this CostPerform example.
The wrong move
A red-margin client appears on the report. Leadership gets frustrated. Someone says the account is “not worth it.” The team either keeps suffering with no changes, or cuts the client without asking why the account went red in the first place.
That usually misses the core issue. Was pricing wrong? Was scope unmanaged? Did delivery drift? Did sales sell a service model the team can't support profitably?
What to do instead
Use a decision frame with four possible outcomes:
- Reprice the account: When the work is valuable but the fee no longer matches the service load.
- Redesign the service level: Move from custom work to clearer packages, tighter response rules, or firmer revision limits.
- Keep for strategic reasons: If the client opens a vertical, improves utilization, or has real expansion logic.
- Exit on purpose: When the account drains time, creates team friction, and has no good path to healthy margin.
Other traps that waste time
I'd also watch for these:
- Bad source data: If time logs are weak, the model will start arguments instead of ending them.
- One-off snapshots: A single month can mislead. Look for patterns, not just blips.
- Reports nobody reads: A PM doesn't need a finance dump. They need a short view of margin, overrun causes, and action items.
- Overcomplicated allocations: If your overhead logic is too complex to explain, the team won't trust it.
“If the report can't tell you what to change next week, it's a history lesson, not a management tool.”
The best client profitability analysis systems are boring in the right way. They use clear rules, repeat often, and lead to the same few decisions: reprice, rescope, reassign, or walk away.
Automating your analysis with TimeTackle
Manual client profitability analysis sounds manageable until you try to maintain it across active projects, account teams, contractors, and changing scopes. Then the spreadsheet becomes its own job.
The core pain isn't only calculation. It's data collection. Someone has to pull timesheets, clean calendar data, reconcile project records, check what was billed, and decide where shared effort belongs. By the time the report is ready, the month is gone and the account team has already repeated the same mistakes.
For professional services, the analysis needs to happen at both the total-client and per-project level, because the same client can include profitable and unprofitable engagements. Margin leakage often comes from scope creep and non-billable overruns, so contract data, project management data, and time tracking need to work together to avoid overstating profitability, as described in PSOhub's guide to customer profitability analysis.
What automation should actually do
A useful system should handle these jobs without constant cleanup:
- Capture work from where it already happens: calendars, meeting activity, and project workflows.
- Tag time consistently: by client, project, service line, or internal category.
- Filter by level: so leaders can see account margin and PMs can inspect project-level issues.
- Export clean data: because finance still needs numbers it can reconcile.
A calendar-based tracker can help. TimeTackle connects calendars and related tools, applies rules and tags to captured activity, and gives teams a way to review time by client or project without relying only on end-of-week memory. That matters because the quality of client profitability analysis depends on the quality of labor data underneath it.
What usually works better than spreadsheet rebuilding
In practice, I'd automate the front half first and keep the finance logic simple:
| Manual approach | Better approach |
|---|---|
| PMs reconstruct time from memory | Capture activity from calendar records and review it quickly |
| Client tags vary by person | Use standard tag rules and naming conventions |
| Project costs live in separate files | Feed them into one reporting view |
| Leadership sees margin after close | Review trend lines during delivery |
The point of automation isn't less thinking. It's less clerical work, which gives the team more time to act while the project is still live.
Setting up a reporting cadence that works
Most agencies don't need more reports. They need a reporting rhythm people will keep.
If the review cadence is too light, problems sit too long. If it's too heavy, the team stops trusting the process because it feels like admin. The sweet spot is a simple operating cadence with different levels of depth.
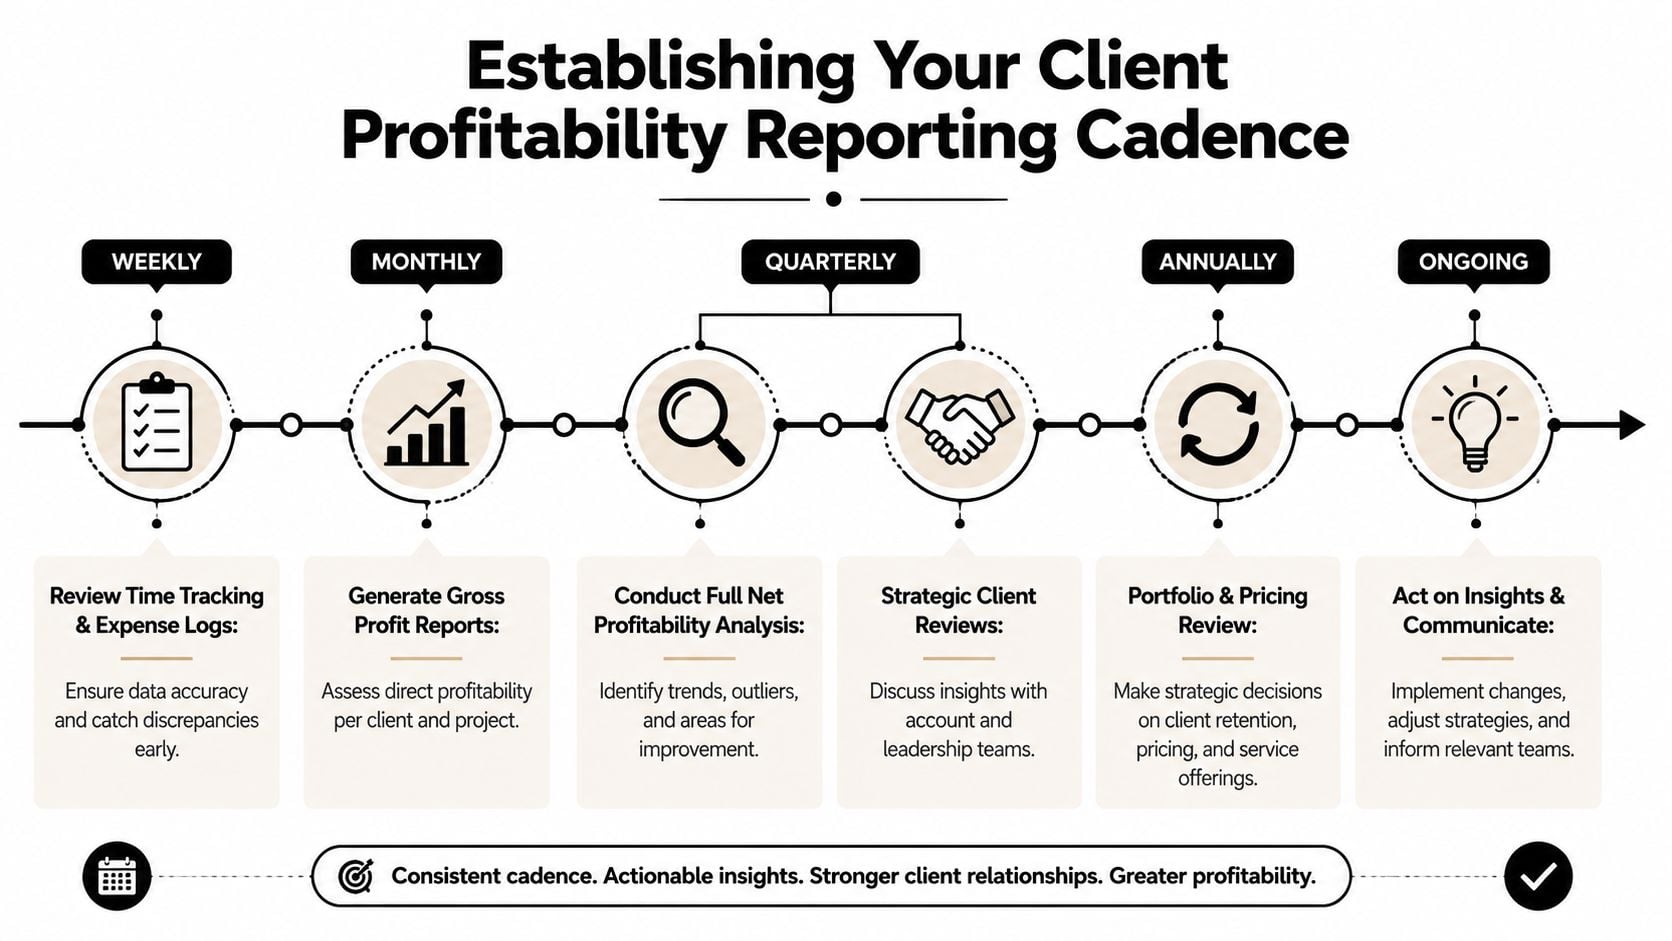
Weekly and monthly checks
Weekly reviews should stay tactical. Keep them close to delivery.
Ask questions like:
- What ran over plan this week?
- Which projects show unusual non-billable time?
- Did any client trigger extra work outside scope?
- Are time entries complete enough to trust the current view?
Monthly reviews should move up one level. At this level, account leads, operations, and finance look at gross profitability trends by client and project type.
Quarterly and annual reviews
Quarterly is the right time for the harder conversations. Pricing changes. Service redesign. Team mix. Whether a client still fits the model.
I like a short agenda:
- Review top and bottom margin accounts
- Check trend direction, not just current status
- Name the cause of erosion
- Assign one action per problem account
Then use the annual review for portfolio decisions. Which services work best? Which client types create the most strain? Where should the agency standardize, raise prices, or stop saying yes?
Who should be in the room
Not everybody needs every report.
- Project managers: weekly delivery and overrun review
- Account leads: monthly margin and scope review
- Operations and finance: monthly and quarterly cost model review
- Leadership: quarterly and annual portfolio decisions
Working rule: Keep tactical reviews close to the people doing the work, and keep strategic reviews close to the people who can change pricing, scope, and client mix.
What a useful report looks like
A good report is short. It should show:
- Client and project revenue
- Direct labor and direct non-labor cost
- Allocated shared cost
- Gross and net margin
- Trend direction
- Required action
If the report is twelve tabs long, people will skim the first page and ignore the rest. If it shows one account, one trend, and one decision, it gets used.
If your agency is tired of chasing time data across calendars, timesheets, and spreadsheets, TimeTackle gives you a cleaner way to capture work, tag it to the right client or project, and turn that data into reporting you can act on. That makes client profitability analysis less of a monthly cleanup job and more of a routine management habit.