



You can have a full staffing chart and still be short on real delivery time. I've watched a 90-person agency hit that wall in the middle of a quarter, when everyone said the team was “fully staffed” and the jobs still slipped because half the calendar was already spoken for by PTO, meetings, admin work, and BAU. That's the gap resource capacity planning is meant to close, and the gap is usually bigger than leaders want to admit.
The mistake is simple. People count heads, then assume those heads are free. Actual work lives in calendars, not org charts, and the calendar is where the truth about usable hours shows up.
Why agencies get capacity wrong more than they think
A creative lead once told me, “We've got 12 designers, so we're fine.” Two weeks later, the same team was in fire drills because three designers were on PTO, two were in client workshops, and the rest were buried in recurring meetings. The headcount had not changed, but the delivery window had shrunk fast.
That is the trap. Agencies talk about people when they should be talking about available hours. Microsoft's capacity planning guidance says to ground the plan in historical utilization, workload patterns, peak usage times, user load, and transaction rates, then translate those signals into resource needs across CPU, memory, network, storage, and personnel. For agency work, the lesson is plain. Demand needs evidence, and the calendar is part of that evidence (Microsoft capacity planning guidance).
Headcount hides the calendar
A producer who exists on paper is not the same as a producer who can take on two more clients this week. Productive's planning model subtracts national holidays and absence to estimate weekly availability, while Atlassian says weekly capacity has to be corrected for working days, hours per day, public holidays, vacation, and sick leave (Atlassian planning guidance). That is why a “14-person team” can behave like a much smaller one once the month fills with meetings, PTO, and admin blocks.
Practical rule: if the calendar says someone is booked, they are booked. A planning spreadsheet that ignores that fact is fiction.
The failure shows up in familiar ways. Utilization targets get missed, weekends disappear into catch-up work, scope gets labeled as “low capacity,” and managers blame the wrong problem because the plan was built on nominal headcount instead of effective supply. Resource Guru's planning model recommends 70–80% productive utilization and 20–30% buffer for BAU, recovery time, and disruption, because planning to 100% leaves no room for normal variance.
That is the core issue. Capacity is not a static number. It changes with the calendar, and agencies that treat it like a fixed spreadsheet line usually pay for it in deadlines, morale, or both.
What resource capacity planning means
Resource capacity planning is the ongoing work of comparing what people can really do with what the pipeline is asking for, then acting before the gap turns into a delivery miss. Microsoft frames it as matching available capacity to forecast demand and then closing the gap through hiring, redeployment, automation, or process redesign (Microsoft capacity planning guidance). That is the cleanest definition I've seen, because it treats capacity as something measured, not assumed.
The math is simple, the inputs are not
The working formula is straightforward, availability minus demand. Retain International uses that logic, where availability is the total hours a resource can work and demand is the hours expected on allocated tasks, and the same basic idea shows up across planning guidance even when the wording changes.
What makes the math hard is the calendar. Contracted hours are not the same as available hours, and available hours are not the same as productive hours. Meetings, admin time, holidays, PTO, and BAU all take a bite out of the week, which means a team's real delivery power is always lower than the raw payroll number suggests (MeisterTask resource capacity planning).
Here's the language I use in weekly meetings:
- Contracted hours: what someone is paid to work.
- Available hours: what's left after holidays, PTO, meetings, and admin are removed.
- Allocated hours: what's already promised to projects or client work.
- Productive hours: what's left for new delivery after BAU and recovery time are protected.
That vocabulary matters because it stops teams from mixing up different kinds of “capacity.” A planner who says “we have room” needs to say whether that means paid hours, free hours, or usable project hours.
A real plan also leaves room for the work the calendar hides. A senior designer can look free on a spreadsheet and still have three client meetings, two internal reviews, a PTO day, and half a week eaten by admin blocks. On paper, that person is available. In practice, they are not. That is why the most useful planning conversations start with calendars, not headcount, and why workforce capacity planning has to account for booked time before anyone promises delivery.
That is the core distinction. Capacity is not a static number, it shifts with meetings, time off, and the work already sitting on the calendar. Agencies that treat it like a fixed spreadsheet line usually pay for it in deadlines, morale, or both.
The six-stage capacity planning framework
The basic mechanics don't change much across vendors or industries. Smartsheet describes the same pattern as forecasting demand, measuring current capacity, comparing the gap, and then adjusting by shifting deadlines, reallocating work, adding resources, or reducing scope, while IBM lays it out as six explicit steps (Smartsheet capacity planning). That consistency is useful, because agencies don't need a new theory, they need a cadence they'll run.
Stage 1 to stage 3
Start by assessing current capacity. In a 60-person creative shop, that means looking at who's free next week, not who belongs to which department. In a 120-person implementation agency, it often means checking whether one senior specialist is bearing too many critical tasks across clients.
Then forecast demand. Pipeline work, signed projects, BAU, and support all belong in the same view because the client doesn't care which bucket the hours came from. If the work is likely to land, it belongs in the forecast.
Next comes gap analysis. That step is where many teams dodge reality. They see a red number and immediately argue about estimates, when the better move is to ask whether the gap should be closed by delaying, re-scoping, shifting, hiring, or automating.
Stage 4 to stage 6
Once the gap is clear, develop a strategy. That can mean moving a deadline, reassigning work, reducing scope, or bringing in extra help. If you want a deeper view of how teams handle this in practice, workforce capacity planning is a useful reference point because it puts people, time, and demand in the same frame.
The plan gets stronger when someone owns the trade-off, not just the spreadsheet.
Then implement the change. If you've moved work off a senior designer, make sure the new owner has the skill and the time. If you've shifted scope, make that visible to the client early instead of after the deadline slips.
Finally, monitor and optimize. Capacity work fails when it ends at the meeting. Good teams revisit the gap, check whether the fix worked, and keep the next review date on the calendar so the plan stays live instead of stale.
Calculating true available capacity from the calendar
Start with the calendar, not the spreadsheet. A team can look fully staffed on paper and still have very little delivery time once meetings, PTO, sick leave, admin, and BAU work are pulled out. That gap is where capacity plans usually go wrong, because headcount does not tell you what is open for project work.
A simple working formula
For agency planning, I use this order:
- Start with contracted weekly hours.
- Subtract holidays.
- Subtract PTO or sick leave.
- Subtract recurring meetings.
- Subtract admin and BAU work.
- The rest is usable project time.
That is the point where most spreadsheets break. They stop at the contract and assume the rest is free time, so the plan says one thing while the calendar says another. The Resource Guru planning guide makes the same point by treating capacity as a reflection of usable hours, not headcount alone.
A producer on a 40-hour week may not have 40 usable hours for project work. Once recurring meetings, admin, and BAU are stripped out, the number drops fast. The exact figure changes by role and by week, but the direction does not. That is why a flat headcount plan overstates delivery power.
The calendar is the better source because it shows the key constraints. Captured meetings, out-of-office blocks, and recurring admin time all take space before a project ever does.
Skill fit changes the number too
A designer with 30 open hours is not the same as a motion designer with 30 open hours. The hours look equal, but the work does not, so the capacity gap may sit in the wrong role even when the team looks balanced on paper.
Practical rule: do not just ask “who is free?” Ask “who is free, and can they do the work without a handoff?”
That is also why multi-role allocations get messy. A person split across three clients may technically have open time, but none of it is in a useful block. The calendar gives you the clearer answer because it shows whether the time is usable for delivery, not just theoretically open. If you want a planning model that keeps this honest as schedules shift, TimeTackle workload forecasting is a useful reference.
If you need help turning that calendar truth into a hiring or resourcing decision, GENTY helps hire operations talent.
Forecasting methods and how to choose one
Forecasting is where agencies either stay calm or get trapped in reaction mode. A simple top-down model is fast, but it can miss skill mix problems. A bottom-up model is more exact, but it takes more time and usually stirs up debates about estimates and ownership.
Top-down and bottom-up do different jobs
Use top-down forecasting when leadership wants a board-level view of the year. It works well for revenue targets and broad growth assumptions, but it can hide the fact that one specialist role is already overbooked.
Use bottom-up forecasting for the next 90 days, when named projects, scoping notes, and booked allocations matter more than broad ratios. It is slower, but it gives you a real picture of who is doing what.
Rolling forecasts sit between those two. They let you revisit demand as new work lands, so the plan stays tied to what's in motion instead of what someone hoped would happen six months ago. Time-based workload forecasting is useful here because it pushes teams to treat workload as a moving signal rather than a fixed promise.
Pick the model by horizon
A practical split looks like this:
- Annual view: top-down.
- Next quarter: bottom-up.
- Weekly review: rolling forecast with live calendar data.
That mix works because agencies live with changing pipelines and messy calendars. A board-level plan can't carry the whole load, and a detailed delivery plan becomes stale too fast if nobody updates it.
If you need help staffing the operations side of this work, GENTY helps hire operations talent is relevant because demand planning analysts are often the people who keep forecasting honest.
The wrong move is to lock one model in place and treat it as universal. The right move is to use the level of detail that matches the decision you're making.
Common capacity planning mistakes agencies keep making
The same few errors show up again and again. The names change, but the failure modes don't.
The usual traps
- Planning to 100% utilization: This gives you no room for sick days, urgent feedback, or rework. New Relic's guidance says software and operations teams should keep at least 30% free capacity for workload spikes, and review mature services quarterly while reviewing new or fast-growing services monthly so capacity stays a live control loop (New Relic capacity planning).
- Treating a spreadsheet as truth: A static file goes stale the moment someone books PTO or a client moves a meeting.
- Ignoring skill fit: A free generalist is not the same as a free specialist.
- Protecting billable hours at all costs: If BAU and recovery time get squeezed out, the team absorbs the cost later.
- Planning once a year: By the time the next annual review arrives, the delivery picture has already moved on.
The fix for each one is the same in spirit. Tie the plan to the calendar, refresh it often, and make room for normal disruption before it hits.
I've seen teams blame “low capacity” when the underlying issue was stale data. I've also seen them overbook high performers because the plan ignored skill constraints, then act surprised when quality dropped. Neither problem is mysterious, and both are visible early if someone is checking the right signals.
The dashboard signal to watch is not just utilization. It's the gap between planned and actual work, the amount of unassigned time that never stays unassigned, and the number of times the plan gets rewritten after the week has already started.
Using calendar-based time capture to sharpen the plan
The calendar is usually the best source of truth a team already has. It shows meetings, PTO, focus blocks, client calls, and the rhythm of the week in a way a manual estimate never will. Capacity planning gets sharper when the calendar feeds the plan instead of sitting beside it.
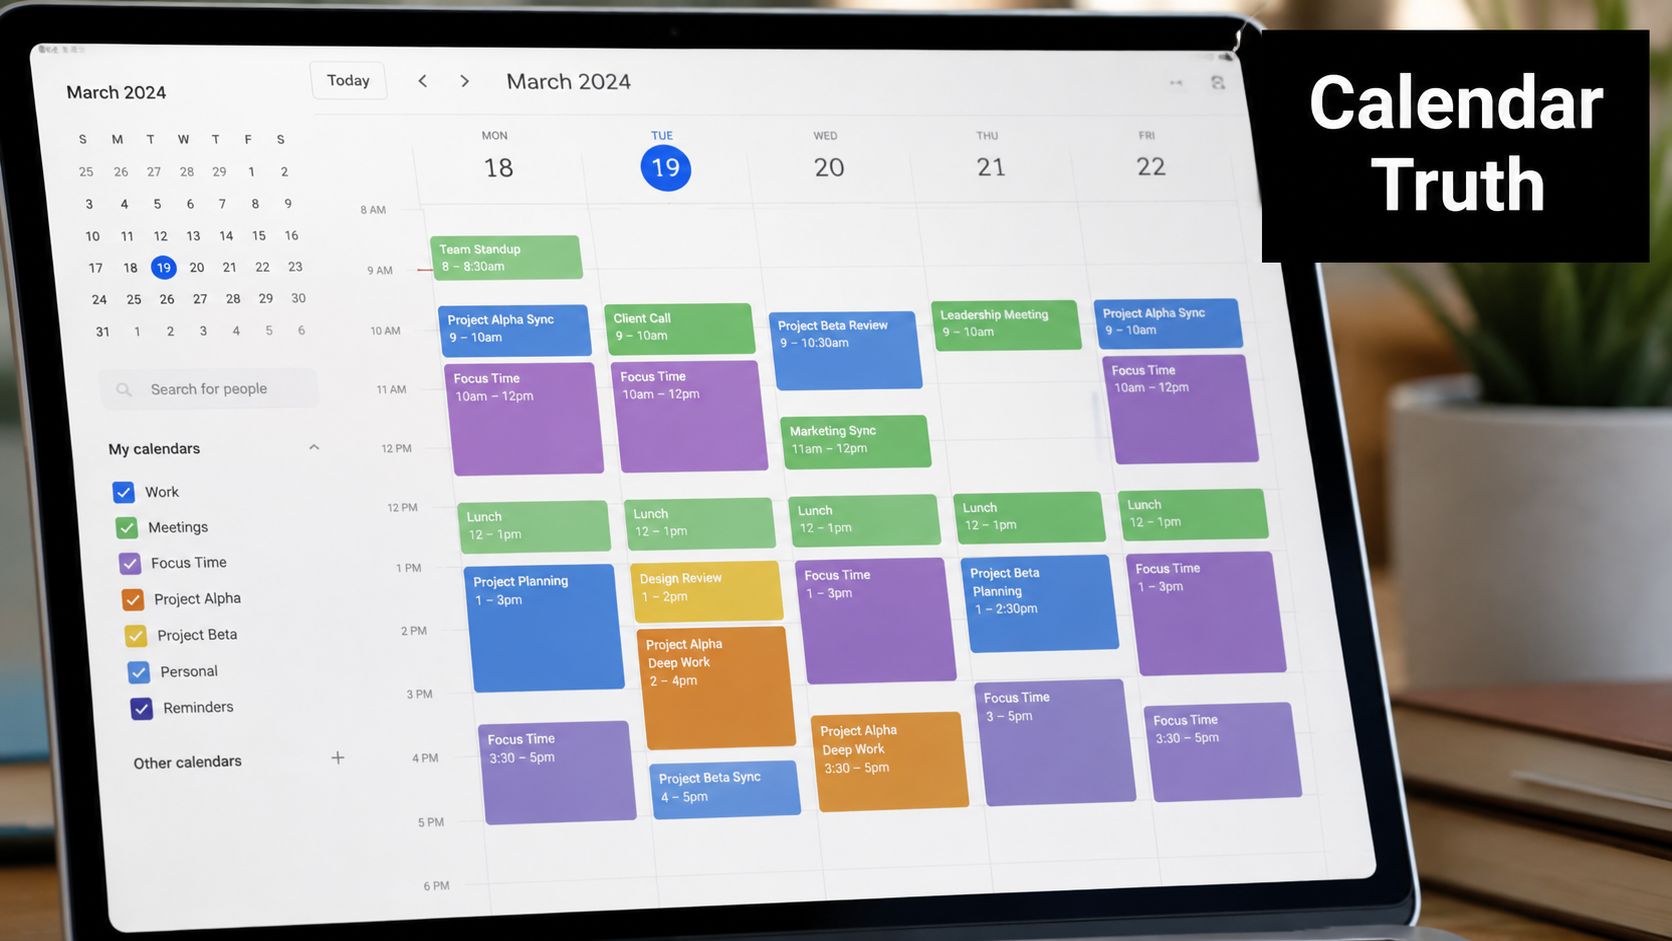
What a calendar-driven loop looks like
Connect Google or Outlook calendars, tag activities by project and client, then let rule-based automations sort the work. That turns the calendar into a planning system, not just a scheduling tool. TimeTackle does this by capturing calendar activity, applying tags and properties, and surfacing utilization and operational efficiency through dashboards, with support for calendar analytics and flexible filters. Tools like TimeTackle's time tracker capture calendar activity automatically and surface utilization without forcing manual entry.
The practical gain is speed. Instead of asking every team lead to remember where the week went, the data is already there. That cuts down on manual updates, avoids arguments about where the hours went, and shortens the time it takes to respond when a client adds more work.
A calendar-backed plan works because it captures reality before people rewrite it in a spreadsheet.
The other advantage is rhythm. When the dashboard shows over-allocation or low availability in near real time, the team can move from quarterly planning to weekly correction. That matters in agencies, where one workshop, one PTO block, or one last-minute pitch can change the whole week.
If you want a template for structuring the numbers, TimeTackle's capacity planning template in Excel is a practical starting point because it keeps availability, demand, total capacity, and utilization in one place.
Putting it into practice with a 90-day rollout
The first 90 days should be about getting the plan to tell the truth. Don't start with a giant process redesign, start with clean inputs, one review rhythm, and a few KPIs that show whether the plan is getting better.
| KPI | What it measures | Target | Cadence |
|---|---|---|---|
| Planned vs actual utilization | How close the forecast came to reality | Narrower gap over time | Weekly |
| Forecast accuracy | How well future demand matched booked work | Improve each cycle | Monthly |
| Over-allocation hours | Time assigned beyond usable capacity | Reduce | Weekly |
| Bench days | Unassigned available days | Track and explain | Weekly |
A simple rollout sequence
Days 1 to 15: standardize calendars, capture one full cycle of activity, and tag work by client and project. That gives you a baseline without asking people to do extra admin.
Days 16 to 45: clean the data, build the first dashboard, and run one gap review against next quarter. Keep the review short, because the point is to learn where the plan breaks.
Days 46 to 90: add scenario modeling, lock in the weekly capacity meeting, and agree on ownership for the KPIs. If nobody owns the review, the plan will drift.
After that, the work is maintenance. Keep the calendar current, keep the review honest, and keep the buffer visible so the team doesn't slide back into headcount math. That's the difference between a plan that looks good and a plan that helps people ship.
If your team is still planning from headcount and gut feel, TimeTackle can help you build the calendar-based view that makes real capacity visible. Visit TimeTackle to see how calendar capture, capacity dashboards, and planning templates can help you turn busy weeks into usable data.