



You've got the project plan, the timesheets, the Slack threads, and the calendar full of meetings, but the story still doesn't make sense. One client account ran over. Another team looked busy all month and still missed the handoff. The numbers tell you what happened. They don't tell you why the work bent the way it did.
That gap is exactly where behavioral analytics helps. For an agency owner or ops lead, it's the habit of reading work as a sequence of actions, not just a pile of totals. When you study meetings, task timing, handoffs, and deep-work blocks together, you start to see the pattern behind delivery problems, scope creep, and margin pressure. If you want a simple starting point on that idea, gain insights into user behavior offers a useful framing, even though it is often applied to products instead of operations. TimeTackle's daily activities log fits that same mindset for calendar-based work because it turns day-to-day activity into something you can review, compare, and act on.
Going beyond the timesheet to answer “why”
A timesheet can tell you that a designer spent six hours on a client project. It can't tell you whether those hours went into deep creative work, repeated reviews, or a series of interruptions that made the task drag. That's the difference between counting output and understanding behavior. In agency operations, that difference matters because two projects can show the same logged hours and still have very different causes for profit loss.
Why the calendar often tells a better story
Calendar data gives you the sequence. You can see the client kickoff, the internal review, the revision cycle, the follow-up call, and the stretch of time that vanished between each step. Once you read work that way, the pattern becomes easier to spot. A project might not be late because the team worked too slowly. It might be late because the team spent too much of the week inside meetings, or because each approval arrived after the next task had already been scheduled.
That's the practical value of behavioral analytics for services firms. It doesn't replace time tracking or reporting. It adds context, so you can explain why the same team delivered one account smoothly and another with friction. Adobe's definition of behavioral analytics, which focuses on the timing, context, and state of fine-grained actions, maps well to calendar-led work because the same logic applies to meetings, handoffs, and blocks of focus time rather than web clicks alone, as explained in Adobe's guide on behavioral analytics.
Practical rule: if a report only shows totals, you're seeing the receipt. If it shows the sequence, you're seeing the work.
That shift matters for leaders who need to protect billable time without guessing. A project manager can look at calendar patterns, notice where the day keeps breaking apart, and ask a better question than “Why are we behind?” The better question is often “What keeps interrupting the work before it finishes?”
How behavioral analytics differs from traditional reporting
Traditional reporting gives you the box score. Behavioral analytics gives you the game tape. One tells you that work happened. The other shows how it unfolded, which means you can see the buildup, the turning point, and the breakdown instead of just the final tally.
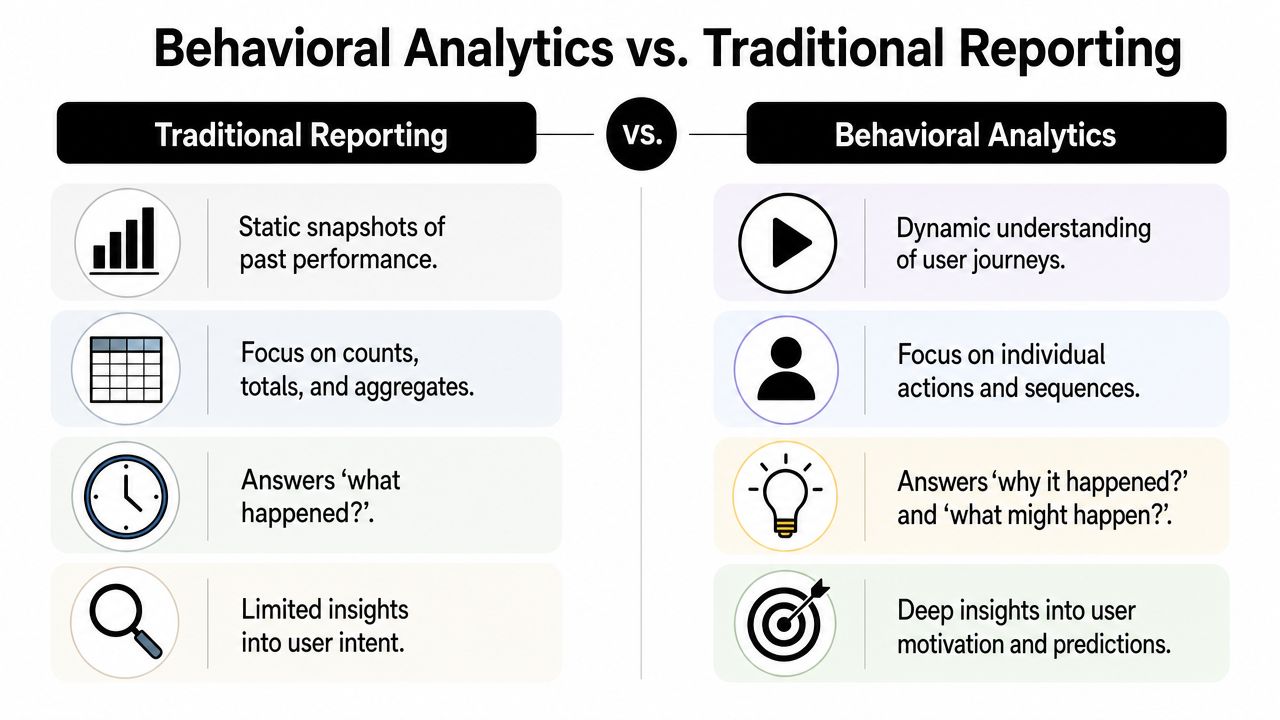
Static totals versus sequences
A timesheet summary says a project used 120 hours. A calendar-based behavioral view asks how those hours were spread across the week, how often the team switched tasks, and where the work stalled. That's the difference between descriptive reporting and diagnostic analysis. The first gives you counts. The second gives you pattern, order, and context.
A lot of agency leaders get stuck on a false choice here. They think they have to choose between reporting and insight, but that's not how it works in practice. Traditional reports still matter because you need the totals for billing, utilization, and forecasting. Behavioral analytics sits on top of that and helps you explain why the totals look the way they do. Modern definitions frame it as the analysis of quantitative and qualitative user data to understand both what people do and why they do it, and that shift from surface metrics to deeper signals is what makes the method useful beyond simple dashboards, as described in Contentsquare's behavioral analytics guide.
What changes when timing matters
Sequence-aware analysis is a significant departure from older reporting. If you know a strategist spends Monday in client calls, Tuesday in revisions, and Wednesday chasing approvals, you can see why delivery slips even when everyone logs their time correctly. The issue isn't always effort. Sometimes it's the order of work, the timing of meetings, or the delay between one dependency and the next.
Behavioral analytics asks what happened before the problem, not just what showed up after it.
That matters for services teams because efficiency problems rarely announce themselves in a tidy summary. They show up as small delays, repeated context switching, and work that keeps getting reopened. Conviva's framing of behavioral analytics around preserving sequence and context fits that reality well, since it explains why isolated counts miss the reason a project feels harder than it should, as discussed in Conviva's behavioral analytics glossary.
The core concepts every agency leader should know
Once you strip away the jargon, the core ideas are simple enough to use on an agency team. You do not need a data science lab to understand them. You need a working model of what counts as an event, what a journey looks like, and how groups of similar behavior can help you make better calls.
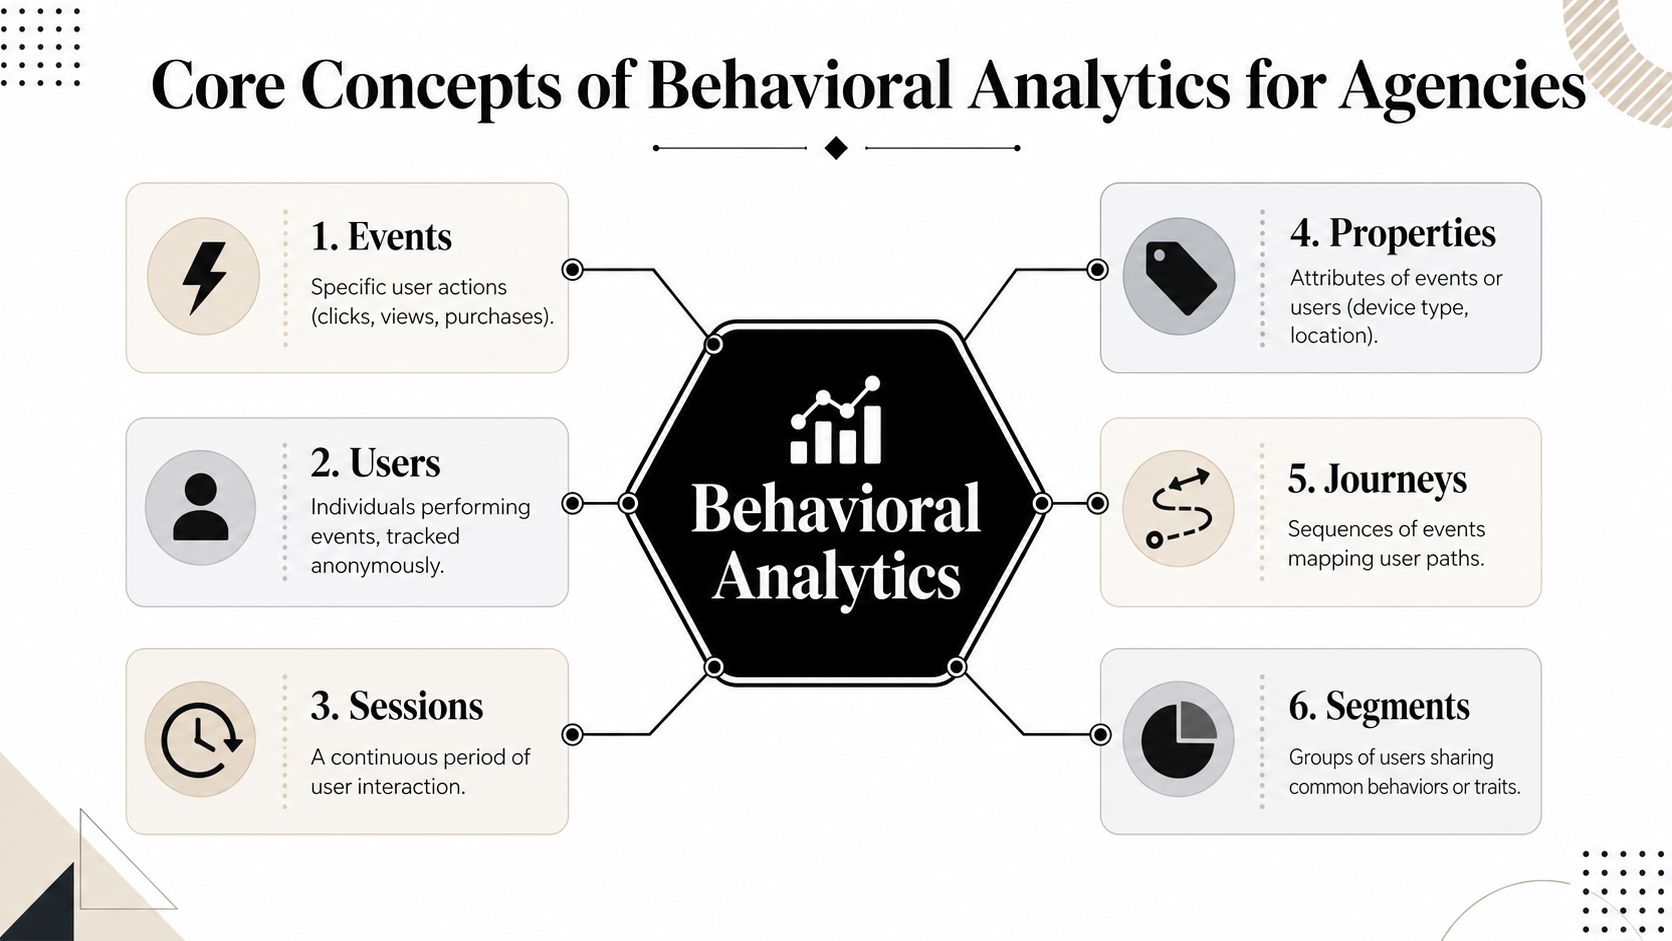
Translate the terms into agency work
An event is any meaningful action. In a product team, that might be a click or a form fill. In an agency, it could be “Client kickoff call,” “Internal design review,” “Proposal sent,” or “Revision approved.” The point is not the label itself. The point is that each event gives you a timestamped signal you can study later.
A journey is the path those events create over time. For a services firm, that's the project life cycle from pitch to delivery. A segment is a group that behaves in a similar way. You might compare accounts that stay profitable with accounts that keep generating after-hours support. A session is a continuous block of activity, which is useful when you want to study one focused sprint or one overloaded day. Properties add context, such as client type, team, meeting location, or project stage.
Use the concepts to ask better questions
The value comes from combining the pieces. If you notice that profitable accounts have shorter approval loops and fewer internal handoffs, that's a behavioral pattern worth studying. If your least efficient projects all show the same mix of late feedback, scattered meetings, and repeated rescheduling, you have a practical clue about what to change.
Mixpanel's guidance is useful here because it ties behavioral work to goals, critical paths, and metrics rather than raw data for its own sake, which is exactly how an agency should think about it. You're not collecting data to admire it. You're trying to answer a real business question, like why one client consumes more non-billable support than another, as framed in Mixpanel's behavioral analytics guide.
Start with one question you'd actually use in a leadership meeting. Then decide which events, journeys, and segments you need to answer it.
That way, the vocabulary stays practical. It helps you separate a healthy amount of collaboration from a schedule that's getting crushed by too many meetings, and it gives your ops team a shared language for talking about work patterns without slipping into vague opinions.
Four practical use cases for professional services
A lot of agency reporting breaks down because it watches the wrong thing. It tracks effort after the fact, then asks people to explain what already happened. Behavioral analytics is stronger when it uses calendar and time data to watch the flow of work while the work is still taking shape.
1. Spotting meeting bloat before it eats the week
One account team may look productive on paper because everyone is busy. Then you look at the calendar and see that internal meetings keep breaking the day into pieces too small for actual delivery work. That pattern doesn't always show up in a timesheet summary, because the hours still get logged.
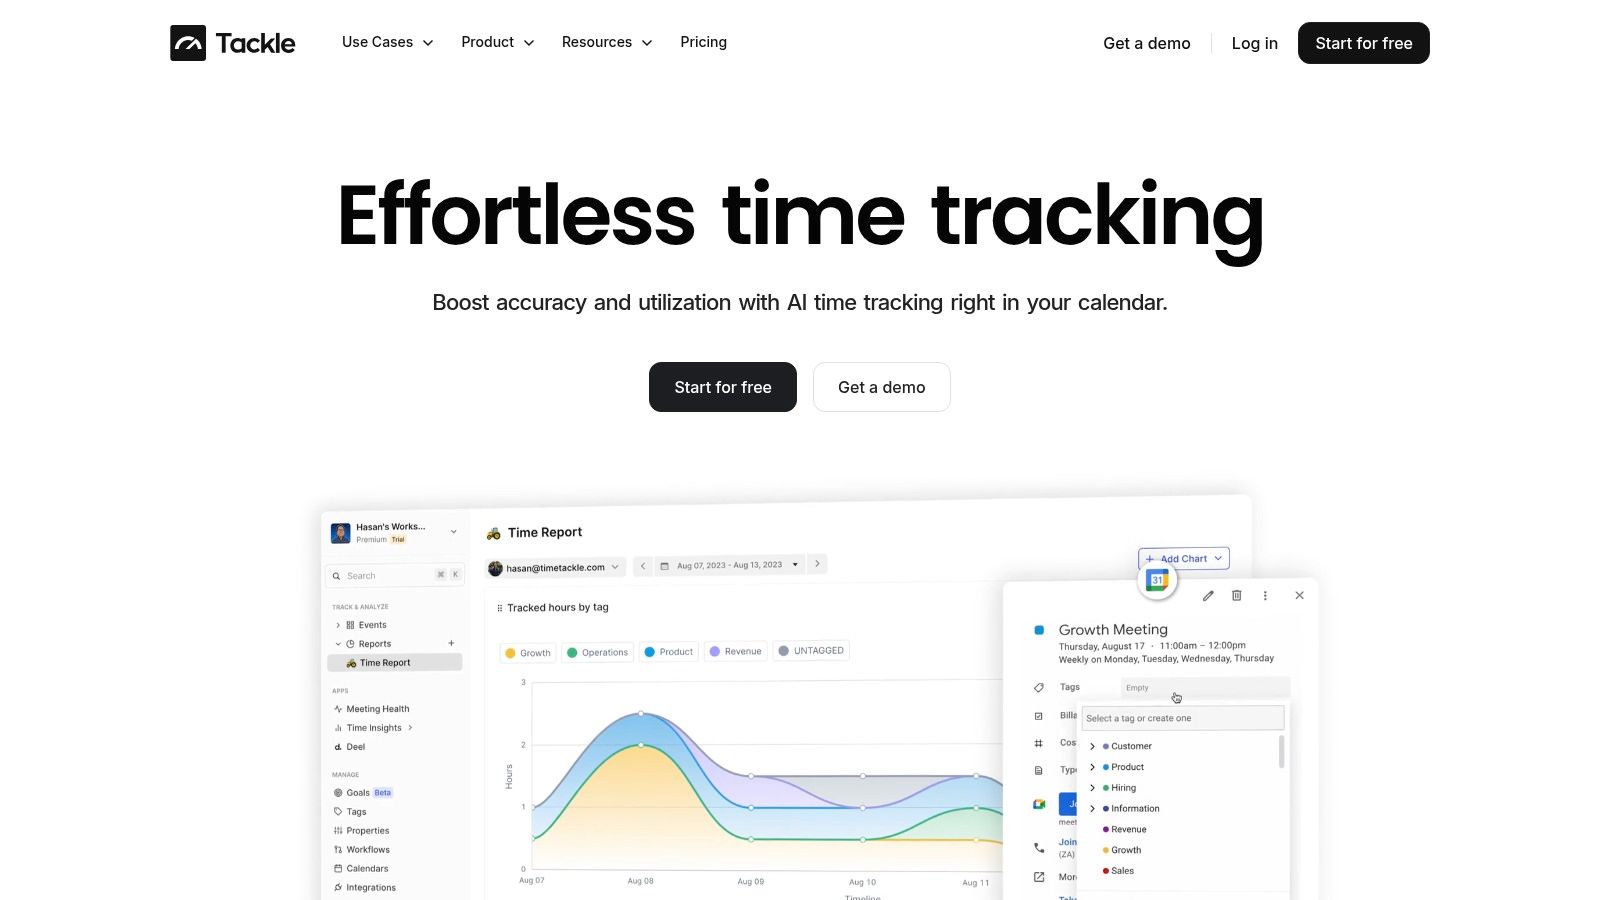
A calendar-based behavioral view makes the overload visible. You can compare internal meetings to client-facing meetings, check where deep-work blocks keep disappearing, and decide whether a team is spending too much time coordinating instead of producing. TimeTackle's calendar analytics and reporting approach is built for that kind of review because it uses schedule data to surface work patterns, utilization, and time use across projects and teams.
2. Finding scope creep in the real work trail
Scope creep rarely arrives as one big obvious event. It shows up as extra revisions, side requests, and “quick” calls that slowly shift the shape of the job. If you map the actual flow of tasks and meetings against the original project plan, the drift becomes easier to see.
The service line item that loses money is often the one everyone thinks is “almost fine.” The calendar trail tells a more honest story. It can show that a project needed three approval cycles instead of one, or that a small request added repeated client check-ins that no one budgeted for. Behavioral analysis is useful here because it connects the sequence of work to the business outcome, not just the final delivery date.
3. Matching the right team to the right kind of work
Some teams handle client feedback loops well. Others move faster on build-heavy work. If you compare work patterns across teams, you can see who finishes certain task types with fewer interruptions or less non-billable cleanup. That doesn't mean one team is “better.” It means the work may fit one group more naturally than another.
Don't assign by habit. Assign by pattern.
That simple shift can improve resource planning because you stop guessing which people should carry which work. The goal is not to over-measure individuals. The goal is to make the team's structure match the type of work in front of it. The broader behavioral analytics market also reflects that demand for action-linked insight, with one forecast valuing the market at USD 1.5 billion in 2025 and projecting growth to USD 7.63 billion by 2034 at a 17.81% CAGR Fortune Business Insights.
4. Making profitability forecasts more grounded
Forecasts get shaky when they rely on clean assumptions instead of real behavior. A project that looks simple in the pitch may consume more support, more meetings, and more rework than the estimate expected. If you study past projects by actual activity pattern, you can build a better sense of which kinds of work tend to stay on plan and which ones drift.
That does not give you perfect prediction, and it shouldn't. It gives you a more honest model. A services leader can use those patterns to price more carefully, staff more realistically, and spot jobs that need a margin cushion before they start bleeding time.
A step-by-step guide to adopting behavioral analytics
A lot of teams think they need a giant data project before they can use behavioral analytics. They don't. The cleaner move is to start with one question, use the data you already have, and prove value on a narrow slice of the business.
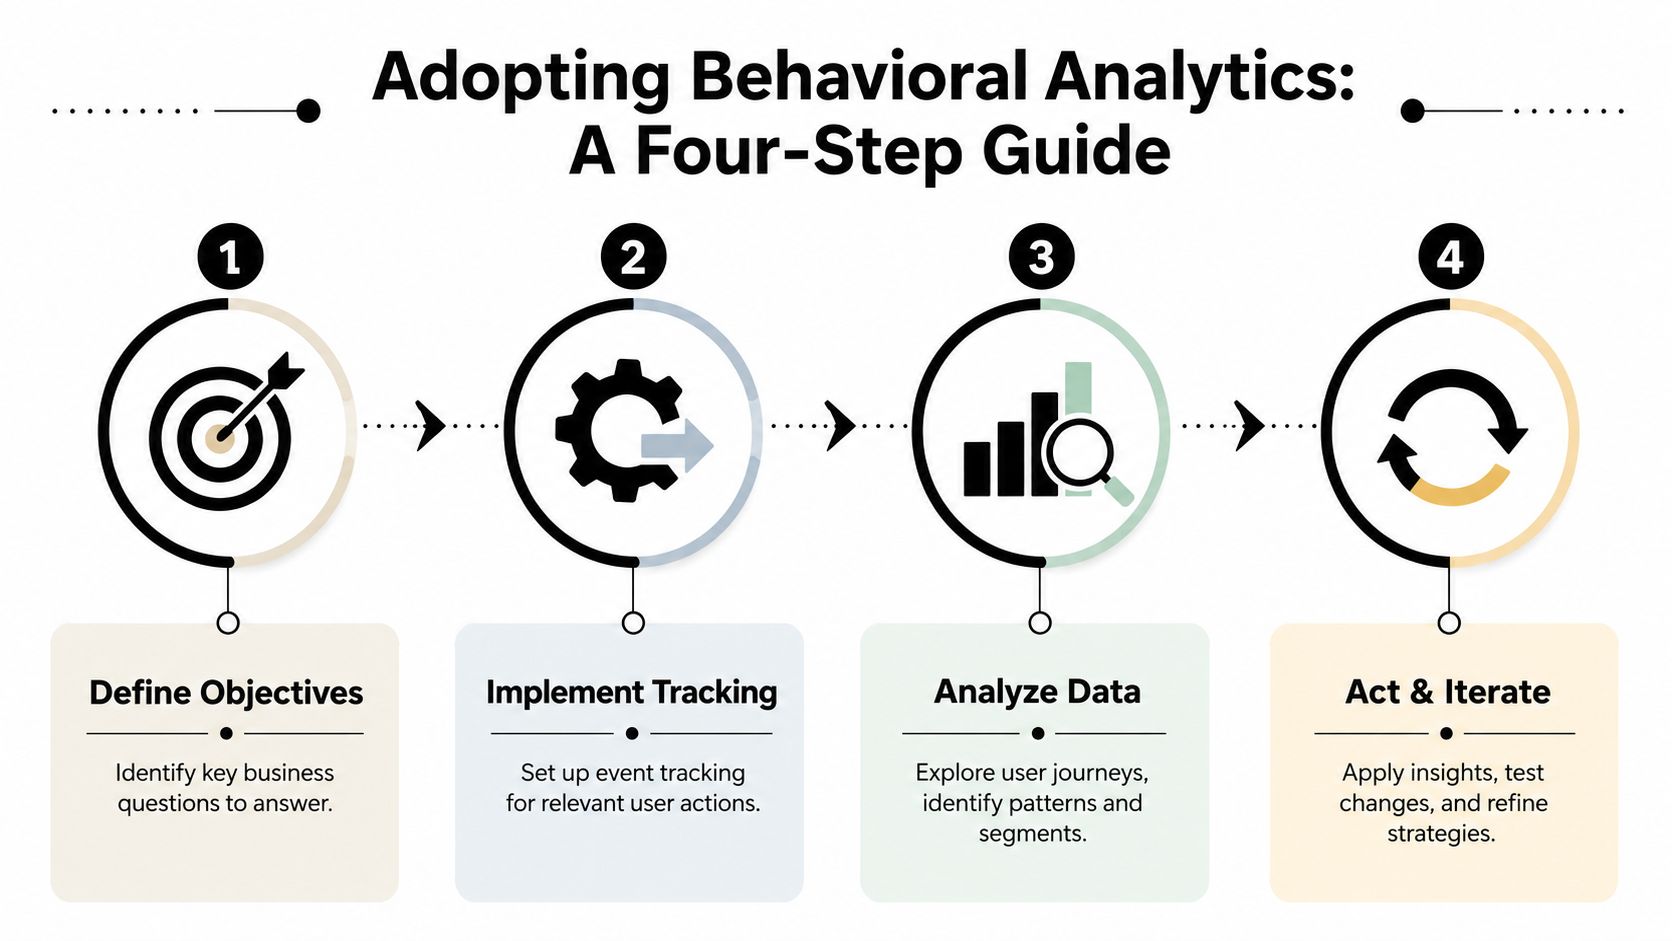
1. Start with one operational question
Pick a question that matters to margin, delivery, or team health. “Which clients need the most non-billable support?” is better than “How do we analyze everything?” Clear questions make bad data easier to spot, because you know what you're trying to prove or disprove.
2. Pull the data you already own
Calendars, project tools, CRM notes, and time logs already contain most of the useful signals. Behavioral analytics works well when it combines those sources into a fuller view of work patterns, so you can see what happened in sequence instead of in isolation. You don't need perfect coverage on day one. You need enough consistency to compare real behavior across a useful period.
3. Choose a tool that can turn activity into patterns
Some platforms stop at reporting. Others help organize activity into tags, properties, filters, and dashboards that make analysis easier. TimeTackle is one option here because it focuses on calendar data, activity capture, and reporting across projects, clients, and teams, which gives agencies a way to study work without asking people to recreate every hour by hand.
4. Run a small pilot and review the result
Pick one team or one client account. Track the behavior, compare it with the business outcome, and see what changes when you adjust the process. That small pilot does two things. It proves whether the method is useful, and it gives the team a low-risk way to get used to the new lens.
The market growth points in the same direction. A forecast valued the global behavior analytics market at USD 1.5 billion in 2025 and projected USD 2.06 billion in 2026 and USD 7.63 billion by 2034, which suggests more buyers now want activity data tied to measurable results Fortune Business Insights.
Common challenges and important privacy considerations
Behavioral analytics is only useful if people trust the way you use it. If leaders treat it like a surveillance tool, the whole effort backfires. The better use is system improvement, not personal policing.
The other challenge is interpretation. A long calendar block can mean focused work, but it can also mean a stalled task or a meeting that ran too long. If you read the data without context, you can draw the wrong conclusion very quickly. That's why team-level patterns matter more than one-off observations.
Keep the focus on process, not punishment
The cleanest rule is simple. Use behavioral insight to improve planning, staffing, and handoffs, then share findings in a way that helps the team. If a group is overloaded with meetings, fix the meeting load. If approvals keep dragging, fix the approval path. Don't turn the report into a leaderboard of blame.
For a useful reference point on how privacy and data use should be handled, Trupeer's Privacy Policy is a good reminder that transparency, purpose, and clear boundaries matter when any system touches personal or work data.
Watch for model drift and false signals
AI-assisted anomaly detection can surface patterns at scale, but it also creates a maintenance problem. Behavior changes. Teams grow. Clients change how they work. What looked unusual last quarter may become normal later, so models need review and tuning. UserPilot's discussion of behavioral analysis challenges is useful here because it calls out false positives, model drift, and shifting behavior as real operational issues, not side notes.
If you want a practical privacy-and-productivity view of employee tracking, TimeTackle's article on productivity vs privacy in employee tracking fits this question well because it treats trust as part of the operating model, not an afterthought.
From raw data to automated operational insight
The fundamental shift is not from manual reporting to prettier dashboards. It's from hunting for problems to having the system surface them for you. When a calendar pattern changes, when meeting load starts crowding out delivery time, or when a project behaves differently from the norm, the leader should not have to discover that by accident.
That is where modern behavioral analytics gets more useful than old reporting. It starts to act like an operations copilot, because it can flag patterns, show change over time, and point you toward the spot that needs attention. Digna's piece on spotting data anomalies in your data platform is a good parallel here, since anomaly detection only matters when someone can turn the signal into a better operating decision.
TimeTackle's performance analytics dashboard fits that future by helping leaders read activity, compare behavior, and move faster from signal to action. If you want to cut reporting drag and see how your team works, use the calendar as your starting point, not your afterthought.
A CTA for TimeTackle.