



If you’re trying to make a checklist in Excel, you’re probably not starting from a blank slate. You already have tasks in emails, notes in Slack, a rough timeline in a spreadsheet, and someone asking for a status update before lunch. That’s usually when the simple to-do list stops working.
I’ve seen this happen in agency operations over and over. A sheet starts as a clean list of deliverables, then grows into a half-project-plan, half-status-report, with colors nobody agrees on and completion notes scattered across columns. Excel can fix that, but only if you treat the checklist as a working system, not a list with boxes next to it.
That’s also why Excel has lasted so long for this job. Checklists in Excel go back to Excel 5.0 in 1993, when ActiveX controls like checkboxes first showed up. That shift drove a 300% increase in Excel’s adoption for project management among Fortune 500 companies by 1995, as spreadsheets moved from calculation tools into workflow tools, according to this Excel 5.0 checklist history reference.
Why your project needs more than a simple to-do list
A project checklist has to do more than tell people what exists. It has to show what’s done, what’s blocked, what’s overdue, and what needs attention right now. If it can’t do that, the sheet becomes admin work.
What breaks in a basic task list
Most messy project sheets fail in familiar ways:
- No shared status logic. One person writes “Done,” another uses “Complete,” someone else changes the row color manually.
- No rollup. You can’t tell if a project is on track without counting lines by hand.
- No reporting path. The checklist helps the person editing it, but not the manager trying to review ten projects at once.
- No protection against accidental edits. A sort, a paste, or a deleted formula can break the whole thing.
That’s why a checklist needs structure. The best Excel checklists create one clear action per row, one status input method, and one reporting layer that updates without manual cleanup.
A useful checklist doesn’t just store work. It reduces the number of decisions people make while updating work.
Why Excel is still a good first move
For many teams, Excel is still the fastest place to build order. People already know the basics, it’s flexible enough for custom workflows, and it can handle everything from a launch checklist to a recurring client delivery process.
It also gives you options. You can build a fully interactive sheet with real checkboxes. You can keep it simple with symbols for printing. You can use dropdowns when your team needs controlled status values instead of yes-or-no completion. The right method depends less on what looks nice and more on how your team operates.
Choosing the right checklist method for your project
Not every team should start with form control checkboxes. That’s the most common tutorial path, but it’s not always the smartest one. If you only need a printable handoff sheet, checkbox symbols are faster. If you need consistent statuses across many users, dropdowns often hold up better.
Structured Excel checklists do pay off. Teams using checklist features like progress formulas and conditional formatting see 35% to 50% higher task completion rates, and 82% of US and EU agencies use those kinds of features for milestone tracking, based on this 2024 Excel checklist reference.
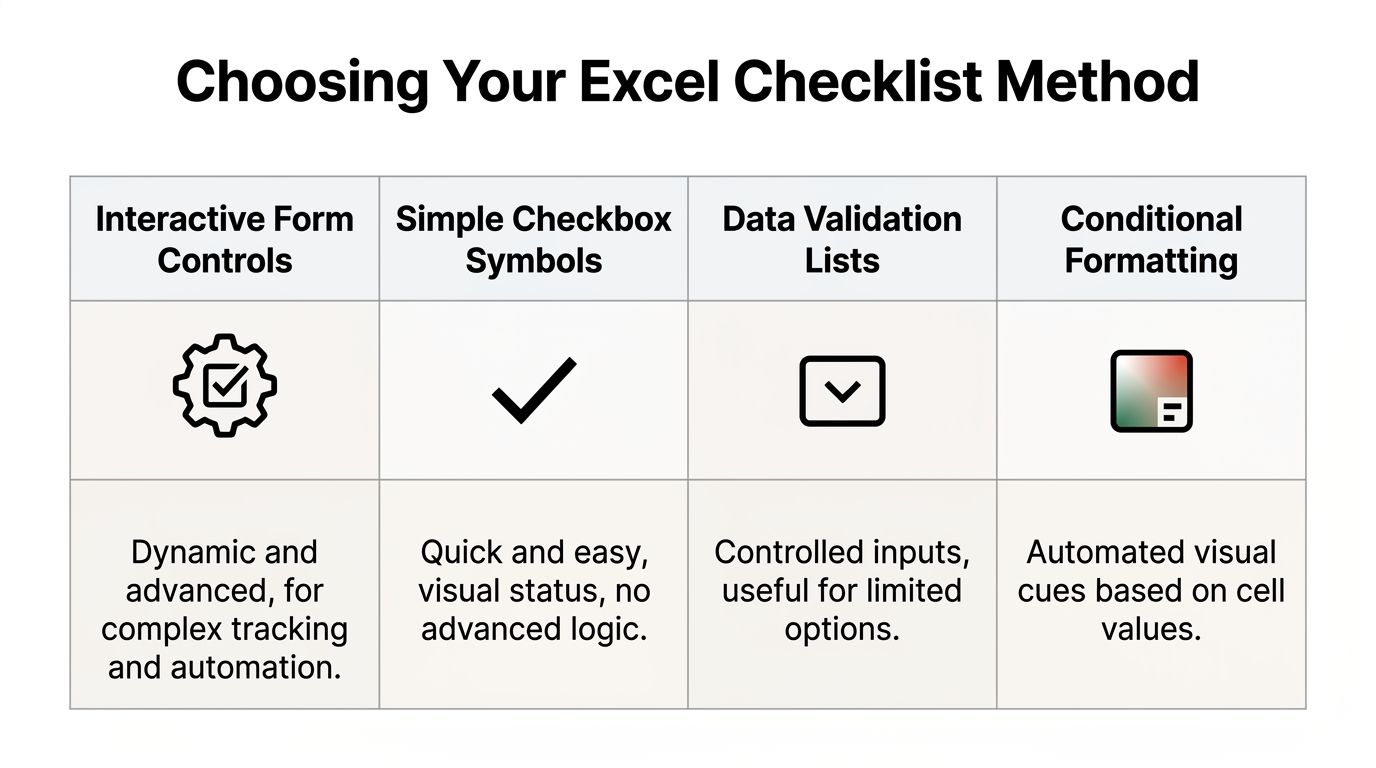
Comparison of Excel checklist methods
| Method | Best for | Ease of use | Interactivity |
|---|---|---|---|
| Form Controls | Project trackers, audit sheets, active task management | Medium | High |
| Symbols | Printable lists, quick personal tracking | Easy | Low |
| Data Validation | Team status tracking, controlled inputs | Easy to medium | Medium |
| Conditional Formatting only | Visual review sheets, dashboards | Medium | Medium |
How I choose between them
I usually make the call based on the update behavior, not the project size.
If people need to click a box and instantly mark a task complete, use Form Controls. This is the classic checkbox setup. It works well for an owner-managed checklist where rows don’t move much and reporting depends on true/false logic.
If the sheet will be printed, copied into meeting packs, or used by people who won’t touch the Developer tab, use symbols. It’s less dynamic, but it’s fast and stable.
If several people will update the file and you need status values like “Not Started,” “In Progress,” “Waiting,” or “Done,” use Data Validation. You lose the visual feel of a checkbox, but you gain consistency.
If your checklist already exists and you just want visual status without changing the input method, use conditional formatting. It’s the least disruptive fix for an existing sheet.
A practical rule for teams
Practical rule: The more people who edit the file, the less I trust freeform inputs.
That’s one reason I like dropdown-based status columns for shared operations sheets. They’re boring, but boring is good when five people are updating deadlines at once.
If you want a good example of how structured checklists force better decision criteria, not just better formatting, this Checklist for Choosing a Cloud Backup Provider is worth a look. It’s not about Excel mechanics. It’s useful because it shows how a checklist works best when each line item is specific enough to review, assign, and verify.
The interactive method using form control checkboxes
If you want the classic Excel experience, this is it. You click a checkbox, the row changes, and your progress formula updates. For solo owners, PMs, and ops managers, this is still the cleanest way to make a checklist in Excel.

Step 1. Set up the sheet properly
Start with a simple layout:
- Column A for the task name
- Column B for the checkbox link result
- Columns C onward for owner, due date, priority, notes, or phase
In row 1, use clear headers. Then list tasks in Column A. Keep each row to one action. Don’t combine “Draft copy, get approval, and publish” into one line. That makes progress reporting meaningless.
Step 2. Turn on the Developer tab
In Excel, right-click the ribbon, choose “Customize the Ribbon,” check Developer, and click OK. You need that tab because Form Controls live there.
Then go to Developer > Insert > Form Controls > Checkbox and place the first box next to your first task.
Step 3. Remove the default label and position the box
Excel inserts a checkbox with text beside it. Delete that text so only the box remains. Resize and align it so it sits neatly in the checkbox column.
Then copy and paste it down the sheet. Don’t hand-place every one unless you enjoy wasting time.
Step 4. Link every checkbox to a cell
This is the step people skip, and that’s where most broken checklists begin.
Right-click a checkbox, choose Format Control, go to the Control tab, and set the Cell link to the matching row in Column B, like B2 for the first task. When the box is checked, that cell returns TRUE. When it’s unchecked, it returns FALSE.
According to the Indeed walkthrough, unlinked checkboxes account for 70% of user errors, which tracks with what I see in practice. A checkbox that isn’t linked is just decoration, not data. Here’s the step-by-step reference on linking checkbox controls and using =$B2=TRUE.
If your progress formula isn’t changing when you click a box, assume the links are broken before you blame the formula.
Step 5. Add conditional formatting that uses the linked cell
Once Column B returns TRUE or FALSE, the useful part starts.
Select the rows you want to format, such as A2:E100. Then go to Home > Conditional Formatting > New Rule > Use a formula to determine which cells to format.
Use this formula:
=$B2=TRUE
Set the format to something obvious. I usually use a muted fill color plus strikethrough on the task name. That makes completed work visible without making the sheet hard to read.
If you want more ideas for styling rules tied to status cells, this guide on conditional formatting based on another cell in Excel is a solid reference.
Step 6. Add a completion formula
Now build a simple progress metric. In an empty cell, use:
=COUNTIF(B:B,TRUE)/COUNTA(A:A)*100
That gives you a live completion percentage based on checked items compared to populated task rows. Format it as a percentage if you want a cleaner display.
A few practical notes matter here:
- Exclude your header row if it throws off the count.
- Keep blank task rows out of Column A if you want clean percentages.
- Don’t mix checkbox rows with notes rows unless you plan for them in the formula.
What works and what usually doesn’t
Form control checklists work well when the row structure is stable and one person manages the sheet. They work less well when people constantly sort, filter, and insert rows without understanding the links underneath.
Common mistakes I see:
- Copying boxes without checking cell links. The visuals copy, but the links stay wrong.
- Sorting only one column. That can separate tasks from their linked cells.
- Adding tasks in the middle of the sheet and forgetting the formatting rule range.
- Overdesigning the file. Too many colors and formulas make a checklist harder to trust.
If you need a checklist for a recurring process, save the finished structure as a locked template. That one habit prevents a lot of quiet damage.
Simpler methods for quick or printable lists
Sometimes the full checkbox setup is overkill. If the sheet is temporary, printable, or meant for low-friction updates, the simpler methods are better. I use them more often than people expect, especially for internal review sheets and meeting prep lists.

Use symbols when speed matters more than logic
You can build a clean visual checklist with symbols like ☐ and ☑. Put the symbol in one column and the task in the next. This works well for files that need to print cleanly or travel as a simple worksheet without active controls.
The trade-off is obvious. Symbols look like checkboxes, but they don’t behave like them. You can’t click them, and formulas won’t read them the same way unless you build around text values.
That said, they’re stable. They don’t break because someone filtered the sheet.
Use dropdowns when the team needs controlled status
For team use, I often prefer Data Validation over actual checkboxes.
Create a status or priority column. Then select the cells, go to Data > Data Validation > List, and enter values like High,Medium,Low. That method can reduce selection errors in multi-phase project reporting by up to 35%, according to this Data Validation checklist guide from Toggl.
You can adapt the list to fit real workflow states:
- Simple project status like “Not Started, In Progress, Done”
- Review flow like “Drafted, Sent, Approved, Published”
- Triage logic like “Low, Medium, High”
A setup I use often
For recurring agency work, I like a compact structure:
| Task | Status | Priority | Due date |
|---|---|---|---|
| Kickoff deck | In Progress | High | 06/12 |
| Landing page copy | Not Started | Medium | 06/14 |
| QA review | Done | High | 06/16 |
Then I add conditional formatting based on the status or priority cell. This gives you consistency without touching the Developer tab.
“Done” is better than a custom color that only one person understands.
If you also build project schedules and planning sheets, this guide on how to make a calendar in Excel pairs well with a checklist because both are often eventually needed. The calendar shows timing. The checklist shows execution detail.
Making your checklist work for the whole team
General Excel advice often proves insufficient. Single-user checklist tutorials are fine for learning, but team use is a different problem. The issue usually isn’t how to insert a checkbox. The issue is what happens after three people edit the file, someone sorts the wrong range, and status reporting stops making sense.

The collaboration problem basic tutorials skip
This isn’t a minor edge case. 68% of teams in professional services report collaboration issues in spreadsheets, according to a 2025 Smartsheet survey cited here, and Microsoft’s 2025 Excel usage report says 42% of business users abandon checklists for tools like Microsoft Lists due to those collaboration flaws, based on this discussion of spreadsheet collaboration limits.
That matches what teams run into in real life:
- Broken links after sorting
- Version conflicts in shared files
- Checkboxes that don’t behave well in co-editing
- Manual cleanup before leadership reporting
- Confusion about which sheet is the current one
What I’d do in a real agency setup
If the checklist is shared, keep the editable inputs narrow and the logic locked down.
Use a template with protected formula columns. Keep task descriptions, status cells, dates, and owners editable. Lock anything that drives reporting. If people need to sort or filter, turn the range into a proper Excel table first and train the team to sort the full table, not one column.
A few habits make a big difference:
- Protect structure. Lock formula columns and hidden helper cells.
- Separate input from reporting. Put summary formulas on a second sheet.
- Use dropdowns instead of free text for statuses and priorities.
- Archive versions by period. Don’t let one live sheet carry six months of history.
- Name the owner of the template. Shared files still need a custodian.
Shared spreadsheets need rules. Without them, every editor is also a potential point of failure.
A better workflow for reporting
For many teams, the cleanest setup is not “everyone updates the Excel checklist all day.” It’s “work gets captured in the system people already use, then Excel gets the clean export.”
That matters most for time, project, and utilization reporting. If your team tracks work through calendars, client meetings, delivery blocks, and tagged project time, pulling that structured activity into a locked Excel reporting template is far more reliable than asking everyone to maintain a giant manual checklist.
One option is TimeTackle’s guide on improving team efficiency, which is relevant because it focuses on reducing manual reporting overhead. In practice, that export-first approach keeps Excel in the reporting layer, where it’s strong, instead of forcing it to be the live collaboration layer for every update.
Advanced tips and reporting workflows
A checklist becomes much more useful once it answers management questions without extra work. You want to know what’s complete, what’s open, what’s overdue, and where effort is drifting. Excel can do that well if the input structure is clean.
Build a simple reporting layer
Start with a few summary cells above or beside the checklist:
- Percent complete with
=COUNTIF(B:B,TRUE)/COUNTA(A:A)*100 - Open items with a formula that counts unchecked rows
- Overdue items if you track due dates and incomplete tasks
- Filtered action views that show only open work
Then add visual cues. Data bars and conditional formatting can turn a dry summary into something a manager can read in seconds.
You can also filter the list to show only unchecked items, which is one of the easiest ways to run standups or weekly reviews. A long sheet gets easier to manage once complete rows fade into the background.
Pair the checklist with real work data
The gap in most project sheets is effort. A checklist tells you whether something got done. It usually doesn’t tell you how much time it took, whether the estimate was realistic, or whether one client keeps creating hidden admin work.
That’s where exported time data helps. If your team tracks work in calendars or linked systems and then exports project, client, or activity data into Excel, you can compare planned tasks against actual effort in the same workbook. That changes the conversation from “Did we finish?” to “Was this profitable, and where did time go?”
If your team spends too much time rebuilding the same weekly reports, this article on how to automate repetitive tasks is a useful next read. The main idea is simple. Keep the checklist logic repeatable, and stop rebuilding reporting steps by hand every cycle.
A good Excel checklist should make status updates easier today and reporting easier next month. If it only does the first part, you’ll rebuild it sooner than you think.
If your team is tired of chasing timesheets and rebuilding project reports by hand, TimeTackle is one way to capture calendar-based work, tag it cleanly, and export structured data into Excel for reporting. That setup works well when you want Excel for analysis and templates, but don’t want Excel to carry the full burden of live work capture across the team.