If you're running a mid-sized agency, you probably know this feeling. The project looked profitable when sales closed it. The team stayed busy. The client was happy enough. Then finance closed the month, and the margin either vanished or never really existed.
That's the point where many teams blame pricing, delivery, or “unexpected effort.” Sometimes those are the problem. Just as often, the actual issue is simpler and more annoying. Your profitability analysis is built on weak inputs.
I've seen agencies spend hours debating whether a project made money when the underlying time data was late, incomplete, or tagged to the wrong client. Once that happens, the math looks clean but the answer is wrong. Good project profitability analysis starts long before the spreadsheet. It starts with deciding what you're measuring, what counts as cost, and how you'll capture work as it happens instead of asking people to reconstruct it days later.
Moving beyond basic profit formulas
Monday morning, the project margin looks fine on the forecast. By month-end, finance closes the books and the same project is suddenly thin or underwater. In agencies, that gap usually comes from using a simple revenue-minus-cost view for work that includes partial allocations, delayed time entry, rework, support hours, and overhead that does not sit neatly inside one project.
A better approach starts with the management decision you need to make. Then you choose the metric, define which costs belong in the calculation, and set up time capture so the numbers update while delivery is still in motion, not weeks later. That operating model is laid out well in Rocketlane's project profitability metrics guide.
Pick the metric based on the decision
Agency teams often get into trouble when they use one profitability number for every question. A delivery lead, a finance manager, and an owner are not trying to answer the same thing.
| Metric | What it tells you | Best use |
|---|---|---|
| Gross margin | Whether the project delivery itself is efficient | Day-to-day delivery decisions |
| Net margin | Whether the work still makes sense after overhead | Portfolio and business planning |
| Profitability index | Whether the return justifies the investment | Go or no-go decisions before work starts |
For live projects, start with gross margin. It shows whether labor is running too hot against earned revenue. If a fixed-fee project is slipping, gross margin is usually the first warning sign operations can act on.
For service lines, client segments, or account planning, net margin matters more. I have seen projects that looked solid on direct labor but fell apart once leadership, QA oversight, account management, and software costs were allocated properly.
Use the profitability index earlier in the cycle, before kickoff, when you need to decide whether the expected return justifies the effort and cash commitment. It is a better filter than a sales-stage judgment call based on utilization targets alone.
Stop treating all costs the same
I've seen bad reporting start with cost buckets that were too broad to be useful. If direct labor, support effort, and overhead all get blended too early, the analysis can tell you a project underperformed without telling you why.
Use at least these buckets:
- Direct labor: Hours spent by delivery staff, contractors, and project-specific specialists.
- Direct non-labor: Travel, pass-through software, outsourced production, and any project-linked purchases.
- Indirect delivery support: Team leads, QA, internal coordination, and shared support functions that touch work but are not booked cleanly.
- Business overhead: Rent, admin, finance, general software, and leadership costs.
Practical rule: If a cost changes because the project exists, treat it as direct. If you would pay it anyway, treat it as indirect and allocate it on purpose.
This distinction matters because gross margin and net margin should answer different questions. Gross margin tells you whether delivery was efficient. Net margin tells you whether that efficient delivery was enough to support the agency structure around it.
Track for management, not just for accounting
In my experience, agencies wait too long to look at profit. By the time someone reviews the numbers, the project is closed, the team is reassigned, and the only remaining task is explaining the miss.
The fix is less glamorous than people expect. Define the metric. Assign costs the same way every time. Capture time as work happens. Review actual versus budget on a weekly rhythm. If your team still relies on end-of-week reconstruction, switch to automated timesheet software that captures work from calendars, meetings, and tools so margin analysis reflects what happened, not what people remember later.
That is how profitability reporting becomes useful to operations. You stop treating margin as a postmortem and start using it to catch delivery problems while there is still time to fix them.
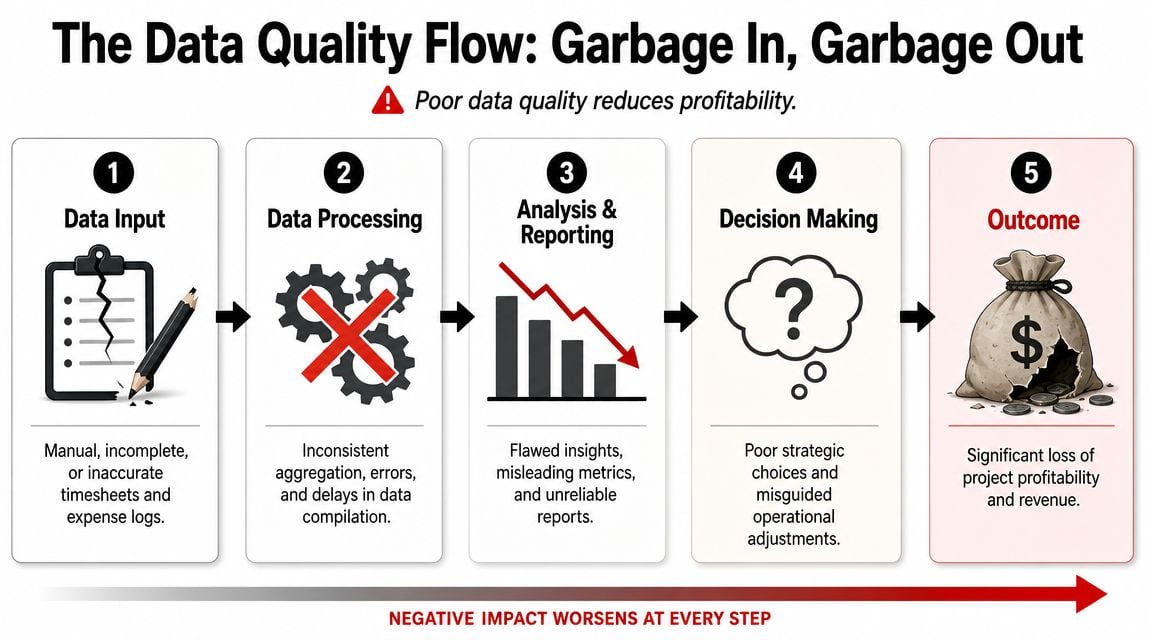
Solving the garbage-in garbage-out problem
Manual timesheets are the part everyone tolerates and nobody trusts.
People fill them in late. They round. They forget internal meetings. They dump time into the closest project code so they can get the reminder email to stop. Then leadership asks for precise margin reporting from data that was guessed after the fact.
PMI's guidance highlights the core weakness here. Profitability analysis becomes unreliable when labor is the main cost and time data is incomplete or delayed. It also points to scope creep as a major blind spot, which raises an uncomfortable question. How much of your reported profit is a real operating outcome, and how much is an accounting artifact shaped by weak inputs and loose allocation rules, according to PMI's project profitability guidance.
Why manual timesheets break down
The usual defense of manual entry is that people know what they worked on. That's true in theory. In practice, they remember fragments.
A strategist may spend part of a day in Google Calendar, part in Zoom, part in a CRM, and part in Slack or docs. By Friday, that work gets compressed into a rough story. The story sounds plausible, but it isn't reliable enough for margin reporting.
Watch for these symptoms:
- Hours arrive late: Reporting tells you what happened after you've lost the chance to fix it.
- Categories are too broad: “Client work” is not useful if you need project-, client-, or phase-level margin.
- Indirect effort disappears: Internal reviews, handoffs, and rescue work often never make it into the project P&L.
- Change work gets buried: Extra requests show up as absorbed effort instead of scoped effort.
If a team hates timesheets, the answer usually isn't “remind them harder.” The answer is to ask why you're collecting critical financial data in the least reliable way possible.
Build the data pipeline where work already happens
The better approach is to capture work from systems people already use, then ask them to review and classify rather than remember from scratch.
For agency teams, that usually means pulling signals from:
- Calendar systems like Google Calendar or Outlook
- CRM records tied to clients, deals, and accounts
- Project tools where delivery tasks and milestones live
- Billing or finance systems where rates and project IDs already exist
Automated time capture significantly enhances the quality of project profitability analysis. A calendar-first setup can collect meetings, client calls, internal reviews, and pre-sales activity as they happen. Then rules, tags, and properties can sort those activities by client, project, work type, or stage. If you're exploring that model, automated timesheet software gives a useful picture of how calendar and CRM data can feed cleaner reporting with less manual entry.
Don't chase perfect data. Chase trustworthy data.
No system captures everything automatically. People still need to review odd cases, recode exceptions, and mark scope changes properly.
The win is not perfect precision. The win is moving from reconstructed memory to observable activity. Once you do that, labor data gets close enough to support actual decisions. That's the point where your project P&L starts to mean something.
Running the numbers on true profitability
Once the data is clean enough to trust, the math gets much easier. The hard part is not the formula. The hard part is deciding what goes in and keeping the method consistent.
For agency work, I like to separate the analysis into two layers. First, measure gross project margin so delivery leaders can see whether the project itself is efficient. Then layer in allocated indirect costs to get closer to true net profitability.
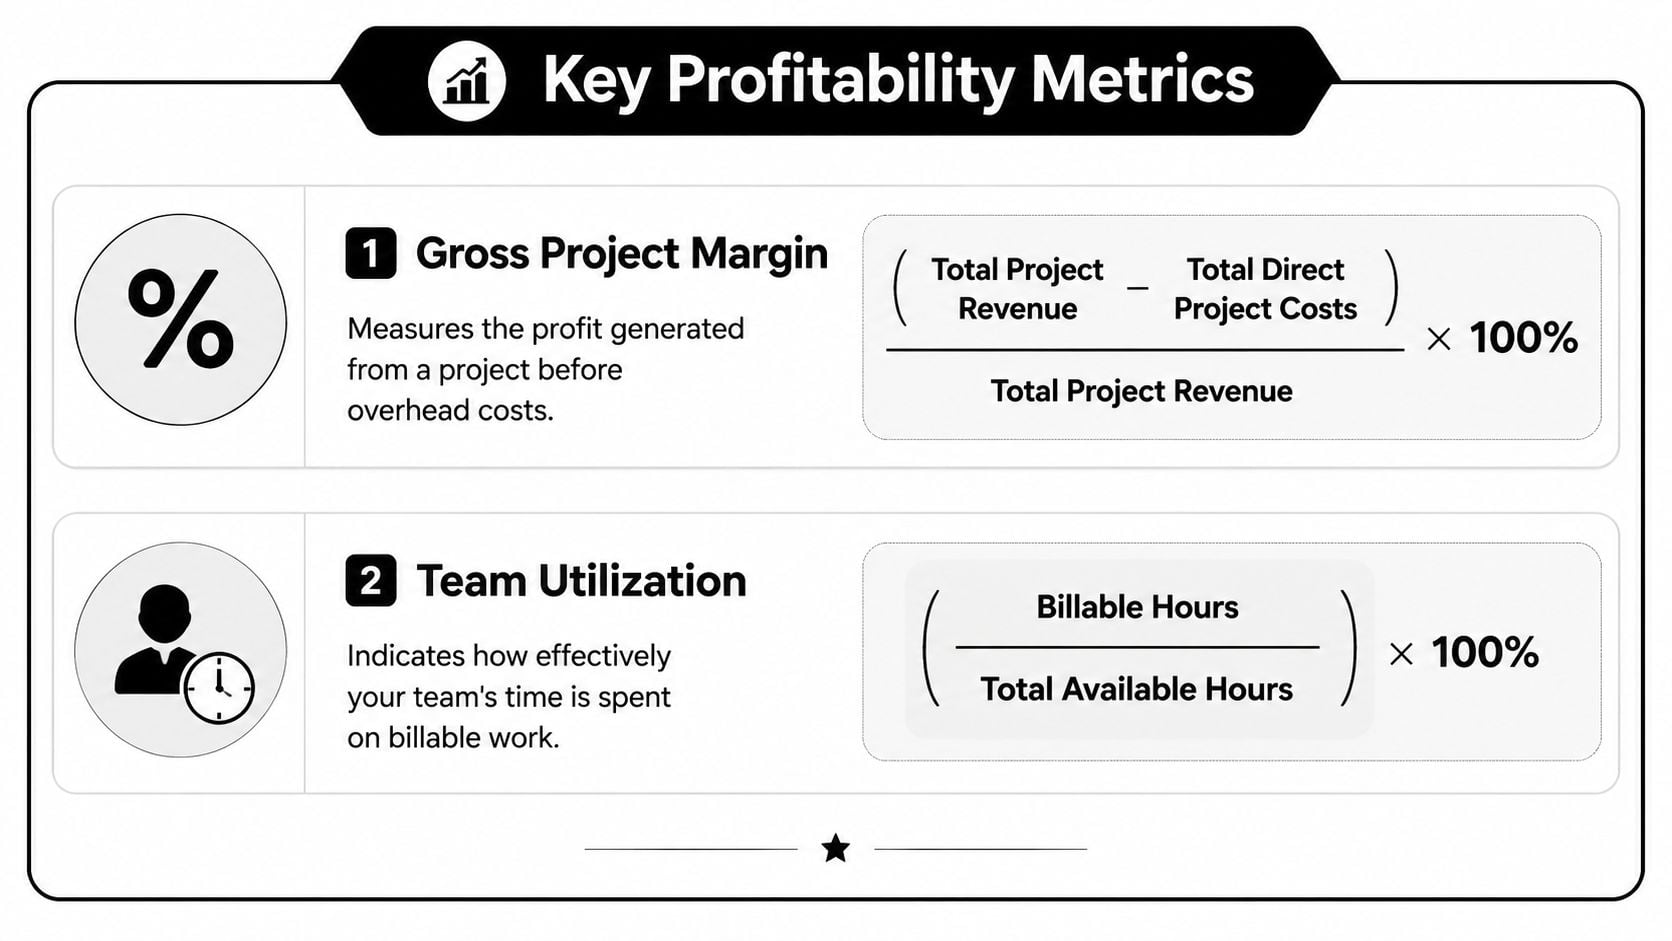
Use simple formulas first
Start with the operational formula:
- Gross Project Margin = (Total Project Revenue – Total Direct Project Costs) / Total Project Revenue
- Team Utilization = (Billable Hours / Total Available Hours) × 100
If you want a quick way to sanity-check utilization inputs before you build the full report, a billable hours calculator can help teams validate the logic.
Here's a practical calculation layout you can use in a spreadsheet or BI tool:
| Line item | What to include |
|---|---|
| Revenue | Fixed fee earned, recognized value, or approved billable amount |
| Direct labor cost | Employee and contractor delivery time tied to the project |
| Direct non-labor cost | Travel, vendors, project software, production purchases |
| Gross profit | Revenue minus direct labor and direct non-labor |
| Gross project margin | Gross profit divided by revenue |
That gives operations a live read on delivery health. It also avoids the usual mistake of mixing general overhead into the same conversation too early.
Allocate overhead without turning it into fiction
The moment agencies try to calculate net profitability, many reports become less useful. Not because overhead should be ignored, but because it gets spread so loosely that the final number becomes hard to trust.
A practical method is to allocate indirect cost using a single stable base. For most agencies, delivery labor hours is the cleanest choice because labor is the main cost driver. If a project used more of the team's delivery capacity, it should absorb more of the indirect burden.
Keep the rule simple:
- Use one allocation base for a reporting period.
- Apply it the same way across all projects.
- Keep pre-sales, delivery support, and business overhead in separate pools if you need clearer analysis.
Working rule: If your overhead method changes every month, your trend line is telling you more about accounting changes than project performance.
There are cases where you need a stricter approach. If you're in a dispute, valuation exercise, or legal context, ordinary management reporting is not enough. In those situations, this guide for SMEs on forensic earnings calculations is useful because it explains how earnings analysis gets rebuilt when the quality of cost attribution really matters.
Read utilization carefully
Utilization is one of those metrics people misuse all the time. High utilization can mean strong demand. It can also mean your team is overloaded, doing too much low-margin work, or absorbing poor scoping decisions.
Use it with margin, not instead of margin. A team can look “busy” and still be attached to weak work. That's why project profitability analysis works best when labor cost, earned revenue, and utilization sit in the same view.
Building your profitability dashboard
Monday at 9:00 a.m., the leadership team opens the weekly project review. Finance has one margin number. Delivery has another. Account management says the project is still healthy because the client is happy. By the time someone reconciles timesheets, write-offs, and scope changes, the week is gone.
That was the breaking point for us. We stopped treating profitability as a month-end report and started running it as an operating view.

A useful dashboard does one job well. It shows whether margin is holding, slipping, or already gone, while there is still time to fix staffing, scope, or delivery pace. That only works if the inputs are current and consistent. If hours are late, roles are miscoded, or expenses sit outside the project record, the charts look polished and still mislead people.
What the dashboard needs to show
The best dashboards connect planning, delivery, and commercial control in one view. The point is not to display every metric available in your PSA, ERP, and time tracking tools. The point is to show the few signals that let an ops lead act early.
My standard view includes:
- Margin trend by project: Weekly movement, not just a final number. A downward slope matters more than a single low-margin snapshot because it shows when the project started to drift.
- Actual versus budgeted hours: Split by role, phase, or workstream. These measurements frequently uncover bad estimates, seniority mismatch, and rework.
- Recovered versus unrecovered scope changes: Extra work should appear as a commercial event, not just more logged time.
- Utilization next to project margin: Busy teams can still be attached to poor work. Seeing both together stops the usual false comfort.
- Write-offs and revenue adjustments: If margin is being preserved by manual cleanup at invoicing, the delivery model is weaker than the dashboard first suggests.
- Data quality flags: Missing timesheets, uncategorized hours, stale project budgets, and unapproved expenses. These are operating issues, not admin trivia.
That last line item matters more than many teams expect. If the source data is unreliable, profitability analysis turns into debate. A dashboard should expose weak inputs, not hide them.
How to set it up so people trust it
Start with one reporting grain and stick to it. For most agencies, weekly project reporting is the right balance. Daily data is noisy. Monthly data is late.
Then clean up the inputs at the source:
- Pull time entries directly from the system your team already uses, instead of asking project managers to rebuild them in spreadsheets.
- Lock role names and cost rates for the reporting period so margin does not shift because someone changed a label mid-month.
- Set one rule for revenue recognition in the dashboard and apply it consistently.
- Require scope changes and write-offs to be tagged to the project, not buried in email or invoice notes.
- Show missing or late data in the same dashboard. If people cannot see the gaps, they assume the numbers are complete.
Many agency dashboards fall short. While their charts appear adequate, the underlying workflow is often insufficient.
If you want to compare layout options before building your own, these performance dashboard examples are useful for seeing how teams organize trend, capacity, and exception views.
What an operations lead actually does with it
A good dashboard changes the meeting agenda.
The first question becomes: where did the project go off plan, and is the cause estimate error, delivery drift, staffing mix, or uncontrolled scope? That leads to decisions people can make the same week. Reassign a more appropriate role mix. Pause non-billable extras. Raise a change order. Reset the remaining budget before the overrun gets normalized.
I look for patterns, not just bad projects. If discovery overruns keep showing up on a specific project type, the estimate template is wrong. If margin drops whenever a certain senior role gets pulled in late, resourcing is wrong. If write-offs cluster around client review rounds, the scope language is wrong.
That is the key value of the dashboard. It helps the team fix the operating system behind profitability, not just explain the result after the fact.
Set alerts, not just charts
Charts support review. Alerts support control.
Use simple triggers people will act on: hours burned faster than plan, margin falling below the project target, utilization dropping on a team that should be fully allocated, or a project running with missing time for more than a day or two. None of this is flashy. It is how agencies catch profit erosion while there is still room to respond.
Build the dashboard for the delivery manager, account lead, and ops owner who need to make decisions this week. Finance still needs the numbers, but profitability improves when the people closest to the work can trust what they are seeing and act on it early.
Common traps that kill agency profitability
Even with decent reporting, agencies still lose margin in predictable ways. The patterns repeat because they usually come from operating habits, not bad intent.
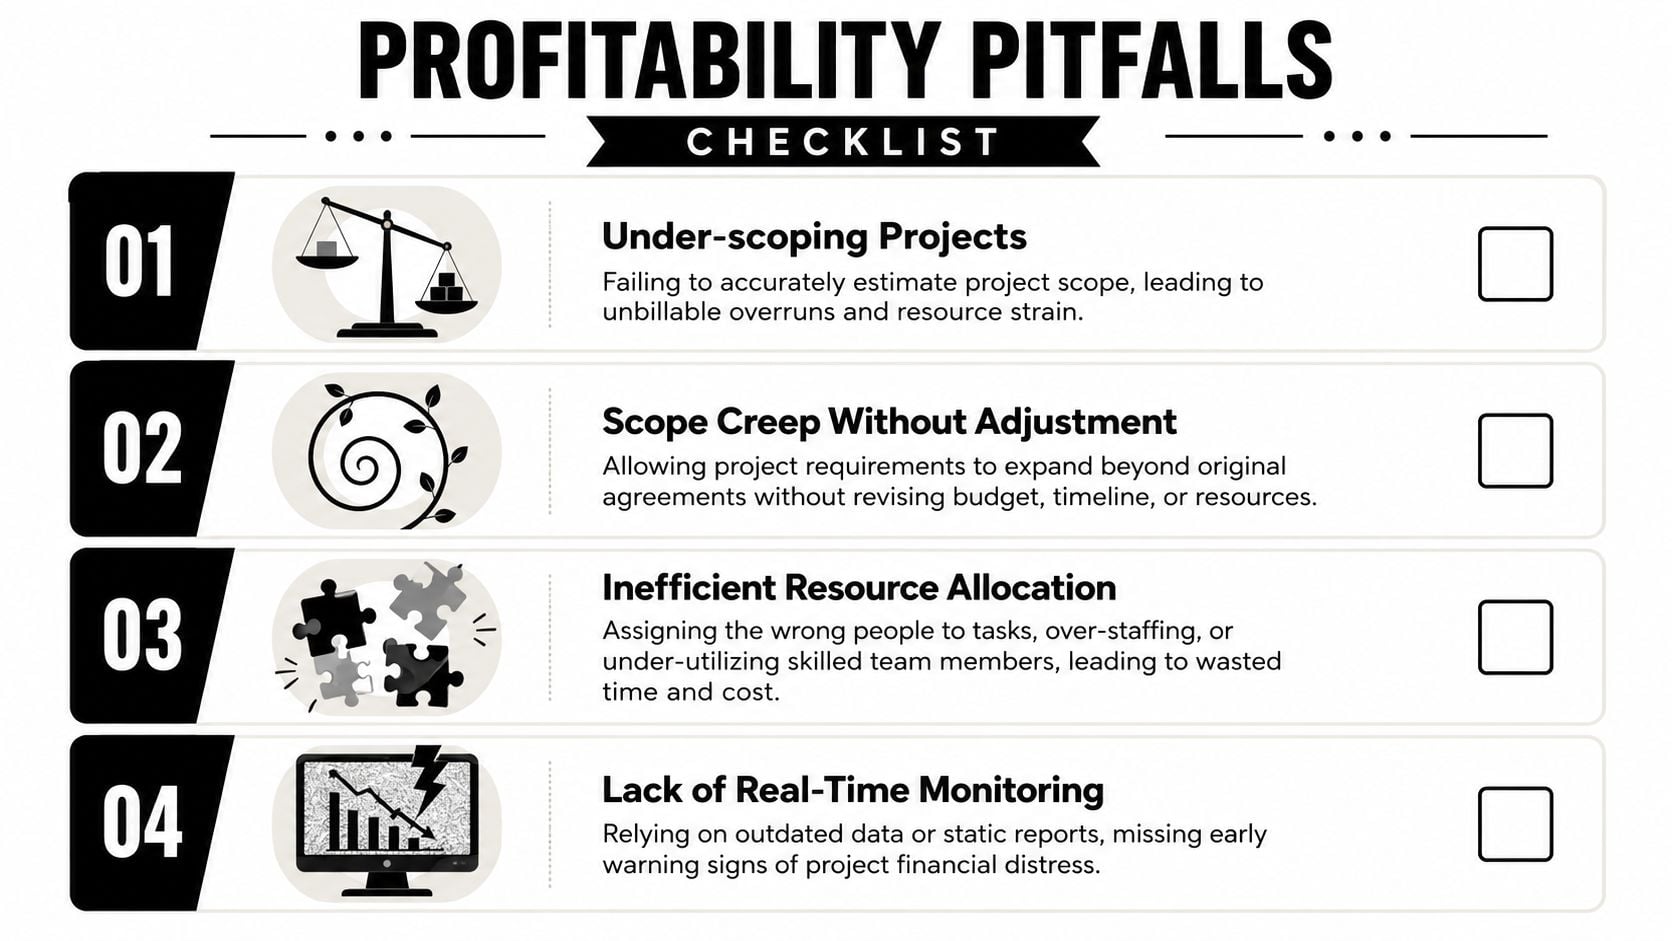
Trap one under-scoping the work
The symptom is familiar. Delivery starts with confidence, then senior people add time to rescue the plan.
The cause is usually a weak handoff between sales and delivery, or estimates built around the happy path. The fix is to price from actual required effort by role, not from what you hope the team can squeeze into the fee. If you already know that some project types always need internal reviews, revisions, or stakeholder wrangling, include that in the scope model instead of pretending it's “extra.”
Trap two absorbing scope creep
PMI's warning on scope creep matters here, because it is often the source of a lot of fake profit in agency reporting. The client asks for a few additions, nobody wants to slow momentum, and the work gets done without changing the commercial model.
The project may still look acceptable if the extra effort is hidden inside broad time categories. It only shows up later when gross margin looks weaker than expected, and nobody can explain exactly why.
Use two controls:
- Tag expansion work separately so you can see what fell outside the original plan.
- Force a commercial decision when extra work crosses a clear internal threshold, even if the client conversation feels awkward.
Trap three using weak rate assumptions
A lot of agencies still use blended rates in analysis because they're easy. The problem is that blended rates can hide a bad staffing mix.
If a senior strategist is doing work that should sit with a lower-cost role, the project can appear stable while labor economics degrade underneath it. Use role-based cost rates where possible. If you must use a blended model, review the staffing mix alongside the margin output so you don't mistake expensive delivery for efficient delivery.
Trap four rewarding hero culture
This one is cultural. A project runs hot, people work around the edges, team leads jump in after hours, and the agency calls it commitment.
What the data usually says is something else. Rework increased. Planning failed. Senior time got pulled into avoidable tasks. If those hours never get booked properly, the project looks healthier than it was.
Agencies often confuse effort with efficiency. Profit comes from repeatable delivery, not from senior people rescuing broken scopes in silence.
The fix is uncomfortable but simple. Record the rescue work, keep it visible, and treat repeated heroics as a process problem. Otherwise, project profitability analysis turns into a report on what your team chose not to admit.
Answering your toughest profitability questions
How should you account for sales and pre-sales time on a project P&L
Don't bury it inside delivery labor. Keep it as its own cost pool.
For management reporting, I'd track pre-sales against the client, opportunity, or service line first. Then decide whether to allocate some of it into won-project economics based on your internal model. What matters is consistency. If you push sales cost into some projects but not others, your comparisons stop being useful.
How should fixed-fee and time-and-materials work be measured
Use the same cost foundation and different revenue logic.
For fixed-fee work, compare recognized revenue against actual direct cost and track margin drift as labor accumulates. For time-and-materials, compare tracked billable work, billed work, and write-offs so you can see whether effort is turning into revenue cleanly. The cost side should stay consistent across both. The revenue side changes because the commercial model changes.
What should you do with strategic or intentional loss-making projects
Keep them in the reporting. Don't hide them, and don't let them distort ordinary team performance views.
I'd mark them as strategic, report them separately, and exclude them from baseline delivery performance scorecards when you need a clean operational read. That keeps the business honest. You can still choose to take low-margin or negative-margin work for a reason. You just shouldn't let that decision muddy your view of how the core operation is performing.
If your team is still rebuilding time data at the end of the week, it's hard to trust any profitability report that follows. TimeTackle is one option for agencies that want to capture work from calendars and connected systems, categorize it with less manual effort, and monitor utilization and project economics with fresher data.