



It's Friday afternoon, the client deck is almost done, and someone on the agency side has slid a fresh ROI slide into the presentation. Then the CFO asks one simple question, how much of this return came from actual tracked labor, and how much came from wishful thinking? That's usually where the room goes quiet.
A lot of agency ROI work falls apart because the model starts with a nice-looking outcome and works backward from there. That's not the same thing as a defendable roi calculation template, especially when the cost sits inside calendars, time logs, revisions, and internal handoffs. If you want a model that survives a finance review, you need the math to follow the work, not the other way around. The split between outcomes and deliverables matters here too, and The OKR Hub on outcomes is a useful reminder that activity is not the same thing as value.
For agencies, the hard part is usually not the formula. It's figuring out which hours count, which costs belong in the stack, and which “wins” are really just one-time bumps dressed up as recurring value. If you're already separating billable and non-billable time in practice, the internal link between work logs and ROI gets much easier to defend, which is why a model built on billable and non-billable time is so much stronger than a clean-looking spreadsheet with no labor trail.
Why most agency ROI numbers don't survive a second look
The first bad sign is easy to spot. An agency lead opens a deck, points to a projected return, and the number looks clean until someone asks what got counted as benefit. In practice, ROI templates fail when teams pad the upside, skip labor costs, or treat a temporary spike like a lasting gain.
The three ways the math usually breaks
The first failure is benefit padding. A team counts every possible upside, but only some of it is real, measurable, or repeatable. That's where outcome-based thinking helps. If the work only changed activity, and not a business result, the ROI line gets shaky fast.
The second failure is hidden labor. Many agency models count software or media spend, then forget internal time spent scoping, QAing, managing, and fixing the work. That leaves out real cost, which makes the return look better than it is. If you've ever wondered why a pitch sounds strong on paper and weak in practice, this is usually why.
The third failure is duration confusion. One-time wins are often booked as if they'll recur every month, which flatters the percentage and hurts trust. A tool rollout that saves a team time once is still useful, but it should not be treated like a perpetual revenue stream unless the data supports that.
This template is for teams that need to justify tools, process changes, or client-facing initiatives with actual numbers they can defend. It's not for vanity slides, and it won't rescue a weak business case. It does give you a structure that keeps benefit, cost, and time in the same model so a reviewer can see what's real.
Anatomy of the ROI calculation template
A solid ROI model starts with a simple formula, net profit or net return divided by the cost of investment, then multiplied by 100 to express a percentage. That structure has stayed consistent in spreadsheet and calculator templates because it works as a shared language for cost versus benefit, and Smartsheet's template guidance keeps that same core logic in place. The basic worked example of a $5,000 investment that produces $15,000 in revenue, or a 200% ROI, is a useful teaching example because it shows how gross return becomes net return once cost is removed. The same source also uses the smaller example of $500 growing to $600, which yields a 20% ROI and helps users see how the formula behaves at a smaller scale. See the spreadsheet template logic in Smartsheet's ROI calculation templates.
What goes in the top, middle, and bottom
At the top of the sheet, I like to keep the assumptions visible and plain. That means naming the initiative, the time window, the expected adoption path, and any revenue or savings assumptions that are still under review. If an input is still a judgment call, make it manual so nobody mistakes it for a live fact.
The middle of the model is the cost stack. A practical agency template should separate one-time costs, recurring costs, internal labor costs, and opportunity costs because those buckets behave differently over time. ToolkitCafe's guidance is blunt about this, and it also recommends reporting simple ROI, annualized ROI, payback period, and NPV so the number reflects time and cash flow timing, not just a raw return percentage. That same guidance also pushes sensitivity analysis, which matters because a single-point estimate can look precise while still being fragile. The logic is laid out in ROI calculator template guidance from ToolkitCafe.
At the bottom, the outputs should answer four questions. What is the plain ROI, how long until payback, what does the annualized return look like, and how much value remains after discounting future cash flow. If the template does not answer those four things, it's not finished yet.
Practical rule: If a cost changes when the team scales, keep it separate. If a benefit only happens once, don't bury it inside a recurring line.
The strongest templates also allow a few manual cells to stay manual. That includes early assumptions, adoption rates, and any value estimate that still depends on a client decision or a rollout choice. Everything else should pull from a source of record when possible, especially labor hours and recurring costs.
| Section | Inputs | Output formulas | Notes |
|---|---|---|---|
| Assumptions | Time period, adoption, value drivers | None | Keep these editable and easy to audit |
| Cost stack | One-time cost, recurring cost, internal labor, opportunity cost | Total investment | Split each cost type so nothing gets buried |
| Benefit stack | Revenue, savings, avoided rework, utilization gains | Total return | Use only measurable return lines |
| Return math | Total return, total investment | ROI, annualized ROI, payback period, NPV | Add sensitivity ranges before final review |
If you want a plain-language guide to the marketing side of the same problem, how to measure marketing ROI is a handy companion because it reminds teams that costs, timeframe, and attribution all shape the final number. The same logic applies here, just with more labor in the stack and more internal work to defend.
Two worked examples from real agency pitches
The cleanest way to test a template is to push two very different deals through it. One is a direct revenue case, the kind agencies love because it feels obvious. The other is the messier one, where the value comes from time saved, fewer corrections, and better use of the team's hours.
Revenue case with a retainer expansion
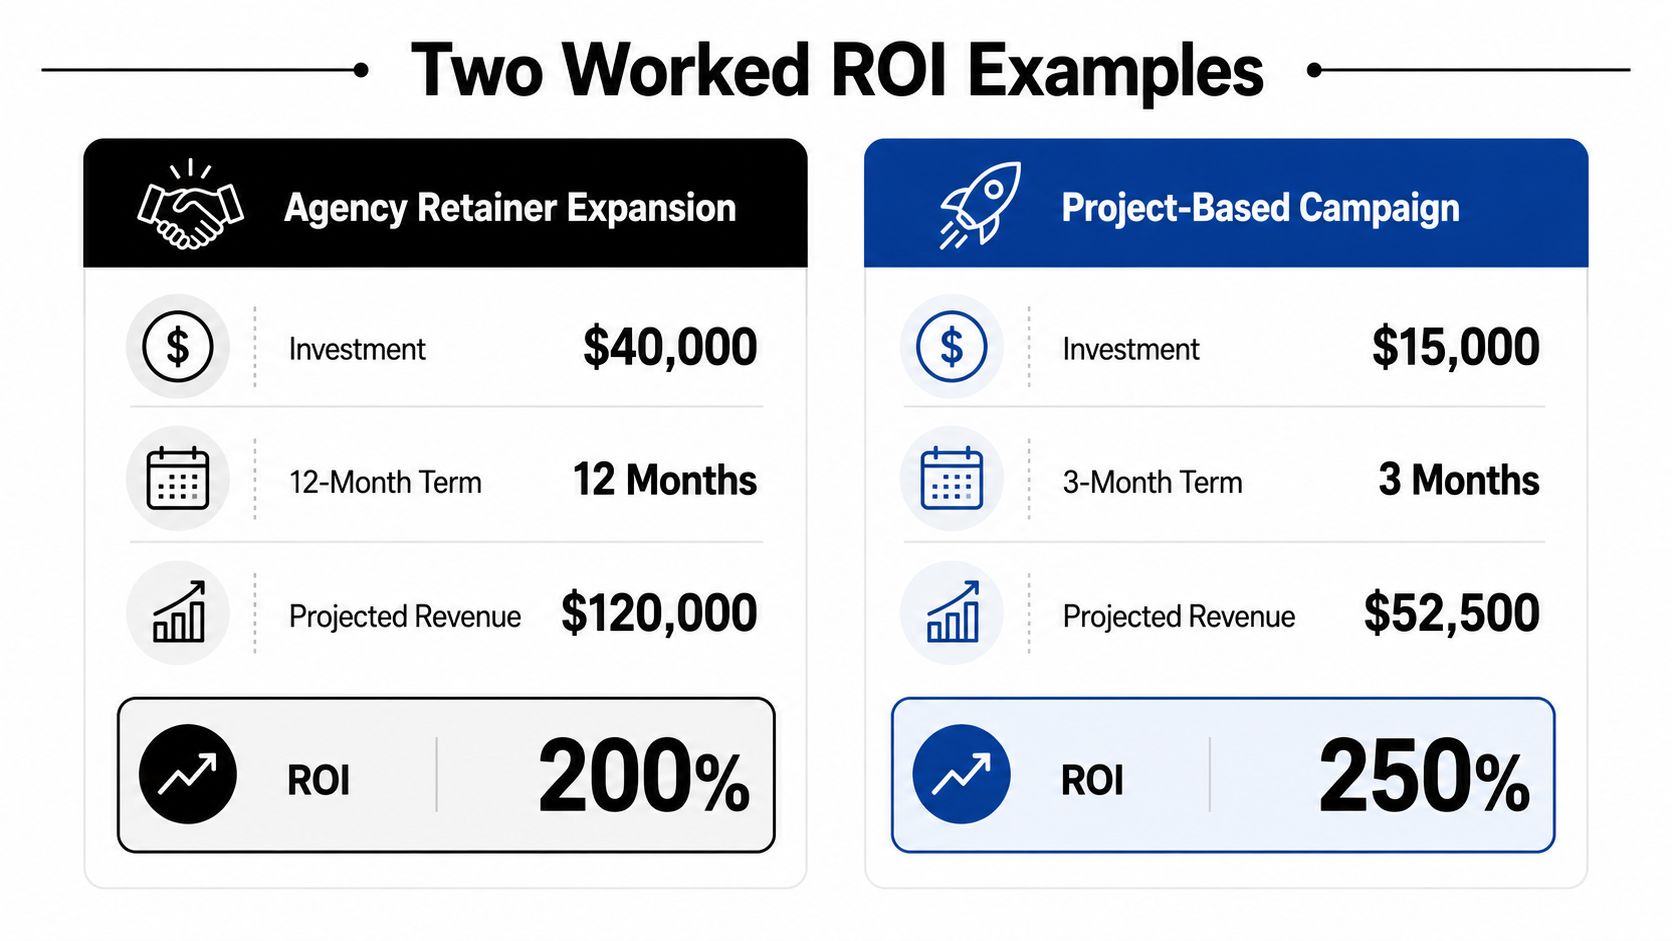
A creative agency wants to expand an existing client retainer. The investment is the extra work the agency has to deliver, plus the internal management time needed to support it. The revenue side is easier, because the gain is tied to the new contract value. The classic template example of a $40,000 investment over a 12-month term with $120,000 projected revenue produces the kind of return shown in the comparison visual, and it's the sort of pitch finance teams can follow because the value path is visible from contract to return.
The important move here is not to brag about the top-line ratio. It's to show where the extra cost sits and whether the work is operationally realistic. If the retainer expansion needs heavier account management than the first version of the work, that labor belongs in the model. If the sales team expects this to close only because the client is already happy, the assumption should stay labeled as an assumption.
Efficiency case with internal time savings
The harder case is an internal tool rollout, because the return is not a new invoice. It's saved time, less rework, and better utilization, which means the model has to translate hours into dollars without making up a fantasy rate. Calendar data and time tracking matter. If a producer captures work in a calendar-based system, the ROI model can use those captured hours instead of guessed averages, which gives you a real input layer for the labor side.
A practical way to write it is simple. If the tool saves team time, price that time with a blended internal rate, then subtract adoption friction and setup overhead before you calculate return. If the savings only appear after a few weeks of learning, don't count them as fully available on day one. That kind of honesty makes the model less glamorous and far more useful.

The internal example belongs in the same template as the revenue case because agencies often mix both in one decision. A new tool might create savings in ops and also help the team sell faster. When that happens, keep the return lines separate so nobody double counts the same benefit.
If you want a simple bridge from project-level math to labor math, the billable hours calculator is a useful reference point because it forces the conversation back to time, rate, and output. That's usually where the truth sits.
Wiring the template to live time data
A static ROI sheet gets stale fast if it never touches real labor data. The cleanest fix is to connect the template to captured hours so cost no longer depends on memory, after-the-fact estimates, or spreadsheet theater. That matters most for agencies, where internal work can swing a project from attractive to marginal without changing the client price at all.
Three ways to feed hours into the model
The simplest path is a CSV export from your time system into Google Sheets, then a mapped import into the labor rows. That works fine when a finance lead or ops manager wants a monthly refresh and does not need live sync. It is also easy to audit because you can freeze the file, check the hours, and compare one month against the next.
A more durable option is a scheduled sync through an API or warehouse connection. That gives you a recurring feed for hours, client tags, project tags, and team-level rollups, which means the ROI sheet can refresh on a schedule instead of waiting for someone to copy and paste. If your agency already keeps operational reporting in a central sheet or dashboard, this is usually the least painful long-term setup.
A lighter technical path is a sheet import function for teams that want automation without a full data build. It is not as reliable as a direct sync, but it can keep labor rows current enough for recurring reviews. The key is the same in all three cases, the hours need to land in the model without a manual rewrite.
Practical rule: If captured hours are not the source, your ROI number is really a guess with formatting.
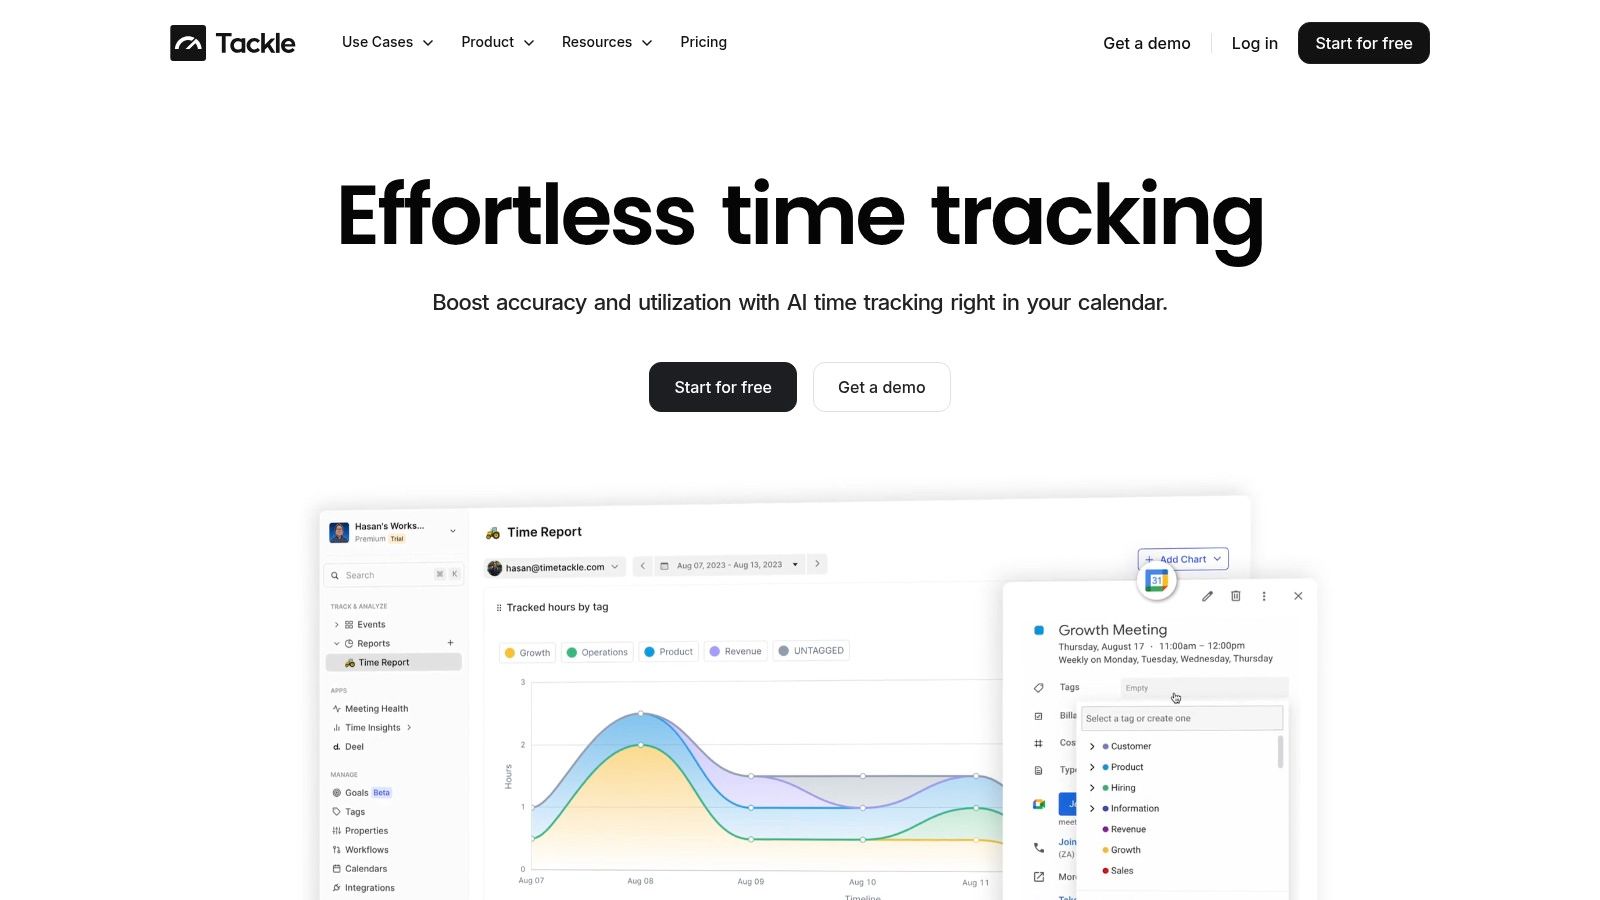
The template rows should then multiply captured hours by the right blended rate, by role or by work type, and roll those numbers into the cost stack. For teams looking at API-driven sync, TimeTackle's API and data integration is one path for getting calendar and work data into a reporting layer without extra manual cleanup. Once hours are live, the ROI model behaves like an operating report, because the labor side updates from actual captured time instead of a hand-built assumption.
Common pitfalls that make ROI numbers meaningless
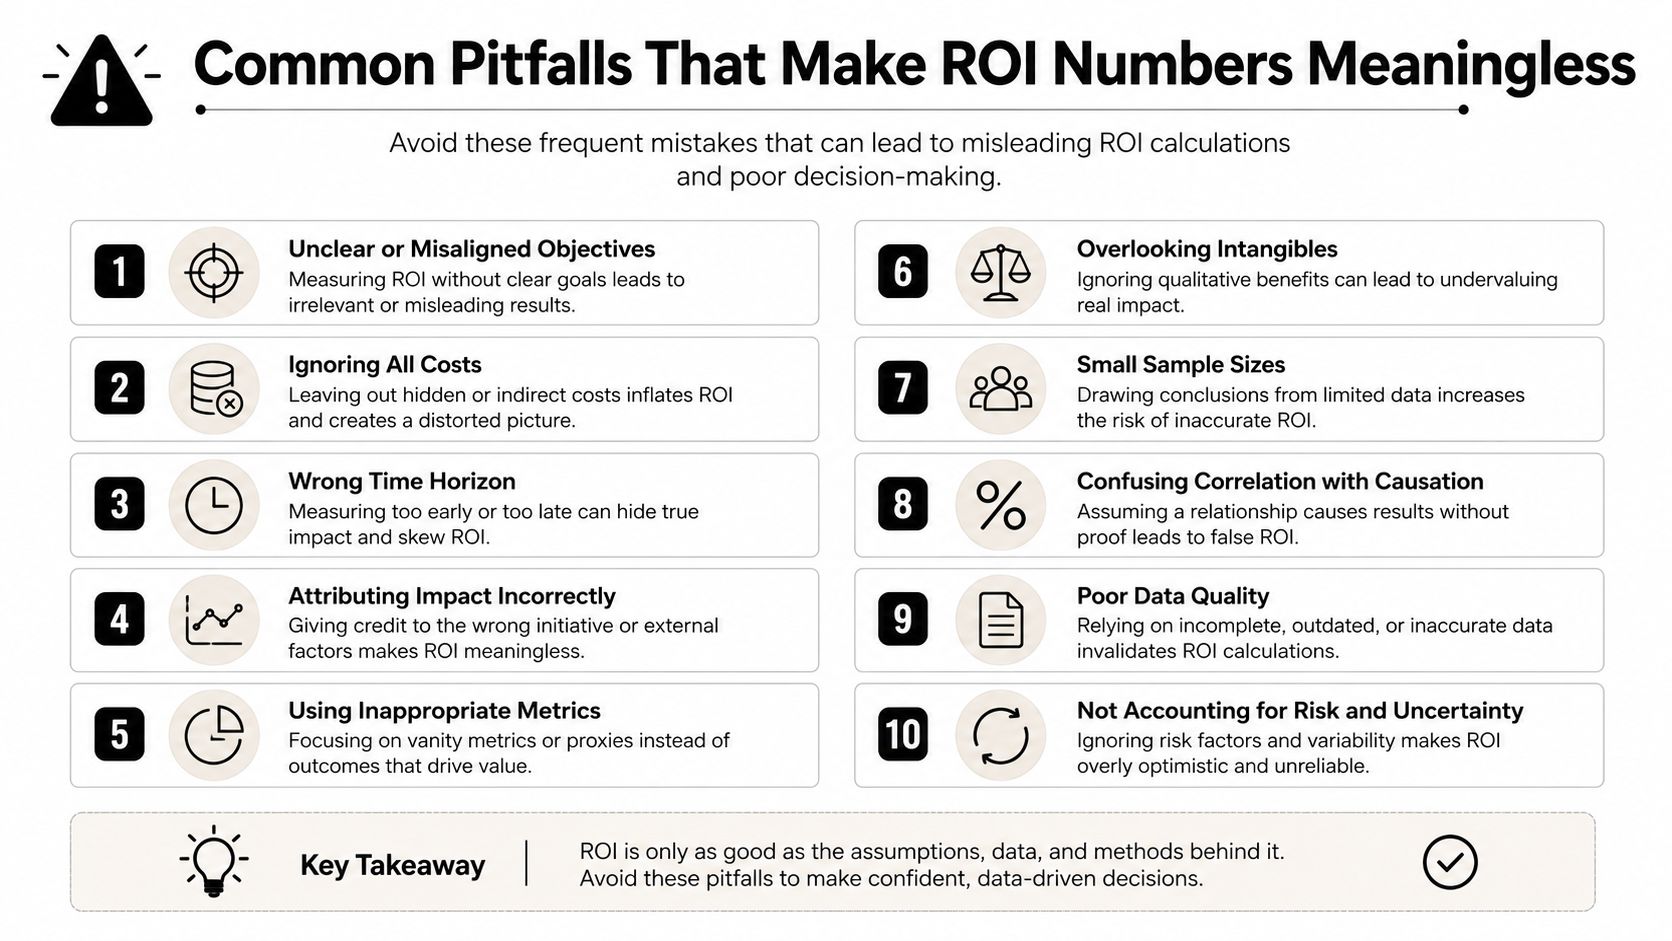
Most bad ROI numbers don't come from bad math. They come from lazy assumptions that make the answer prettier than the work deserves. The result is a model that wins a meeting and loses trust.
The mistakes I see most often
One common mistake is leaving internal labor out of the cost side. Another is assuming full adoption when the team is still learning the process, which makes the return look faster than it really is. A third is mixing up cost avoidance with revenue, which can turn a useful ops save into a fake sales result.
Sensitivity analysis is the other missing piece. If the model changes a lot when one assumption moves, that assumption deserves attention before the deck leaves the building. I'd rather see a range that holds up than a single number that looks bold and breaks under a basic question.
Before review, run this checklist.
- Labor included: Confirm internal hours, support time, and management time sit on the cost side.
- Benefit type clear: Separate revenue, savings, and avoided work instead of blending them.
- Adoption realistic: Use a grounded rollout view, not perfect uptake on day one.
- Time window right: Make sure the return matches the period in which the benefit can appear.
- Sensitivity tested: Check the inputs that move the answer most.
When a deck passes those five checks, it usually survives the next round of questions too. That's the difference between a number that flatters the work and a number finance can use.
Making the template part of your monthly rhythm
A good ROI sheet shouldn't live in a launch folder. Refresh it on a set cadence, keep each version, and review the same assumptions before leadership meetings so the trend line means something. If the number only gets updated when someone asks, it's already behind.
Use a short rollout rhythm. Update captured hours and costs on the first business day, rerun scenarios before the monthly review, and archive the prior version so you can compare what changed. Then set guardrails, like a minimum payback threshold and a required sensitivity range, so the model doesn't get stretched just to tell a nicer story.
- Load the latest hours and costs
- Check the assumption cells
- Run the base case
- Run the downside case
- Review payback and annualized return
- Save the version
- Share the result with finance or ops
That small routine turns the template from a one-off pitch asset into a management tool, which is where it earns its keep.
If you want to stop guessing at labor costs, TimeTackle connects calendar activity to captured work so your ROI model starts with real hours instead of estimates. Visit TimeTackle to see how calendar-based time tracking and reporting can feed cleaner inputs into your next ROI calculation template.